
Macro and
Equity Market
Outlook
Equity Market
Outlook
Global Macro & Markets
Russian-Ukraine conflict led to a massive spike in
commodity prices on supply side disruption
worries. Though nominal yields have been
sprinting upwards, inflation-led lower real yields
led investors to favor equities as an asset class.
Despite war worries, MSCI Word index rose 4.2%
m-o-m on the back of S&P500 (+5.2%), Euro-50
(+3.6%) and NIKKEI (+3.6%). MSCI EM index (-2.9%)
was dragged lower by Hang Seng index (-3.4%),
whereas other EMs gained quite handsomely.
MOEX Russia, BOVESPA Brazil and NIFTY India were
up 9.4%, 6.1% and 4% respectively. MSCI India
outperformed MSCI EM by 6% in March. LME Metals
index gained 4.2% while Brent crude was up 2.8%
m-o-m. Dollar index appreciated 0.9% in March.
India 10Y Gsec yeild rose 8bps whereas US 10Y and
Germany 10Y yields rose whopping 51bps and
41bps, respectively.
Domestic Macro & Markets
SENSEX gained 4% while BSE Midcap index and BSE Smallcap index
were up 3.2% and 5.8% MoM respectively. Energy (+9.8%), Utilities
(+8.8%) and Communication Services (+8.2%) outperformed the
index while Discretionary (-1.9%), Staples (-1.2%) and Financials
(+1.2%) lagged the most. Market breadth improved in February with
42% of BSE 200 stocks trading above their respective 200-day
moving averages. FPIs sold US$4.7 bn of Indian equities in the
secondary market while DIIs bought US$5.2 bn.

India's high frequency data update:
Positive momentum in GST collections, some pick up in
manufacturing activity and steady exports bode well for decent
economic recovery after the mild disruption caused by spread of
the Omicron variant.
GST Collection:
At INR 1.42 Tn, collections in March have marked all-time high levels
and topped INR 1.3 Tn for the sixth consecutive month.
Power consumption:
Power consumption in the month of March was 5.6% higher than
March-21 and 29.7% higher than the consumption in March-2020.
Core sector production:
Core sector production rose 5.8% YoY in February as against a YoY
rise of 4% in January and a decline of 3.3% in February last year.
Industrial Production:
Manufacturing IIP increased 1.1% in January vs decline of 0.9% in Jan
last year.
Credit growth:
Credit growth accelerated to 8.5% YoY as of 11-March against YoY
growth of 6.5% as observed on 12-March 2021. Aggregate deposit
growth remained flat at 8.8% YoY.
Inflation:
CPI inflation in February rose to 6.07% from 6.01% in January on the
back of sequentially higher food (+5.9%) and rural inflation (+6.4%).
WPI inflation increased 15bps to 13.11% in February.
Jobspeak index:
Naukri jobspeak index for February was up 31%yoy led by increased
hiring in sectors like retail and IT.
Trade Deficit:
February trade deficit widened to US$21.2 bn as compared to
US$17.4 bn in January. Exports increased 22.4% YoY to US$33.8 bn
while imports increased by 35% YoY to $55 bn.
Balance of Payments:
The current account registered a deficit of US$23 bn (2.7% of GDP)
in 3QFY22, widening from a deficit of US$9.9 bn in 2QFY22 (1.3% of
GDP) and a deficit of US$2.2 bn in 3QFY21 (0.3% of GDP). This was
mainly due to a widening of the trade deficit to US$60.4 bn (2QFY22:
US$44.5 bn).
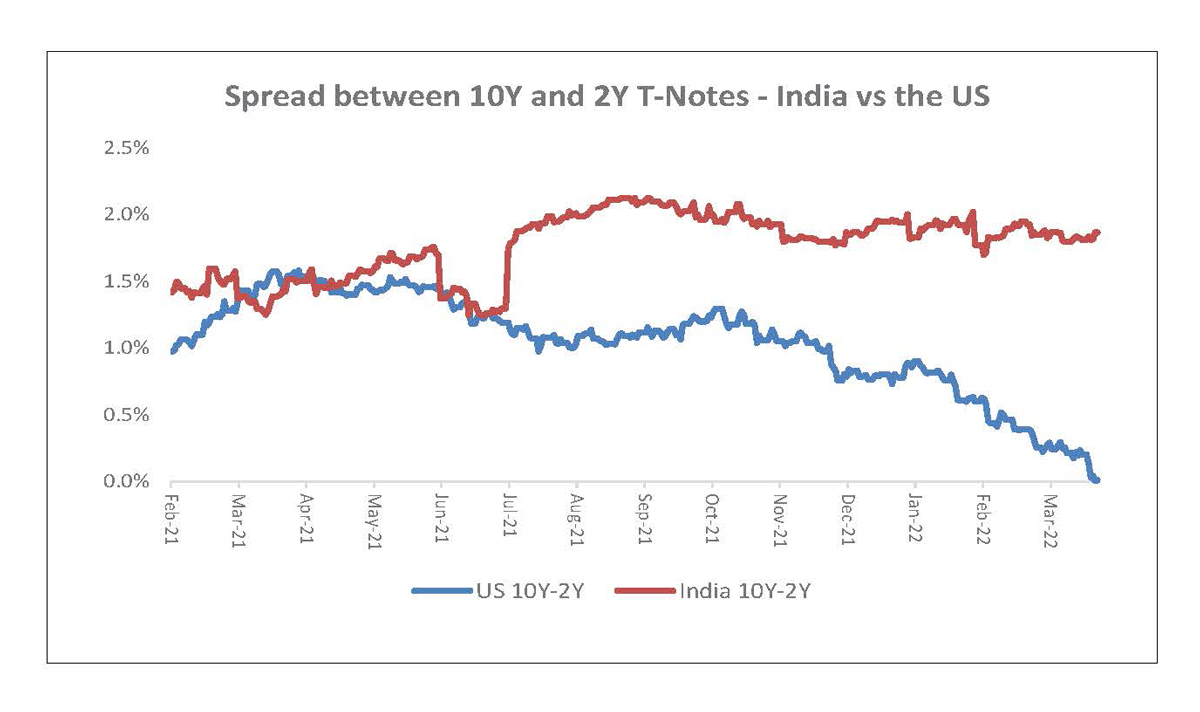
Decoupling of Govt security yield curve in the US and India:
There has been very sharp rise in yields across the curve in the US
market. Not only rates have risen but the short-term yields have
risen faster than long term yields leading to sharp flattening of
yield curve at a time when rates are hardening. Experts are getting
nervous on potential yield curve inversion in the US. A flattening
curve typically means fear of that investors are losing faith on
medium term economic growth outlook. In contrast, G-Sec yield
curve in India remains reasonably steep. This is partly due to RBI's
pro-growth and accommodative stance when domestic liquidity
conditions remain benign as of now.
Market View
Near term market sentiment is likely to be influenced by the
increased geopolitical risks in the backdrop of ongoing
Russia-Ukraine conflict, higher inflation/ commodity prices, rate
hikes by Global Central Banks and most importantly how these
factors impact the Global/domestic growth possibilities.
Accordingly, we anticipate higher than usual volatility or market
swings in the short term.
From a domestic perspective while direct impact of
Russian-Ukraine conflict, through trade channel may be limited, the
indirect impact on Crude prices, Inflation, rising input or raw
material prices needs to be monitored. Notwithstanding the
short-term global risks and assuming that the geo-political
tensions are diffused soon, we remain optimistic on a reasonable
domestic recovery. Key drivers include - relaxation of most COVID
led restrictions across states which may potentially spur demand,
anticipated revival in investment cycle & domestic manufacturing,
etc.
Accordingly, we are attempting to maintain balanced portfolios
through a combination of domestic recovery themes along with
secular businesses. Given the external risks and its potential impact
we believe investing in a staggered manner or systematic route
may help iron out market extremes. Based on the prevailing
valuations diversified funds with allocations across market cap
range may be considered from a medium-term view. Conservative
investors seeking equity exposure with lower volatility may consider
asset allocation strategies like - Balanced Advantage/Asset
Allocator which manage equity allocations dynamically.
Note: The sectors mentioned are not a recommendation to buy/sell in the
said sectors. The schemes may or may not have future
position in the said sectors. For complete details on Holdings & Sectors of NIMF
schemes, please visit website mf.nipponindiaim.com;
Past performance may or may not be sustained in future
Past performance may or may not be sustained in future
Chart of the month :
Rare decoupling visible in the Govt security yield curves of India
and the US. Medium-term growth concerns might likely explain
near inversion of the US yield curve.
Common Source:
Bloomberg, Nippon India Mutual Fund Research
Disclaimer:The information herein above is meant only for general
reading purposes and the views being expressed only
constitute opinions and therefore cannot be considered as guidelines, recommendations or
as a professional guide for
the readers. The document has been prepared on the basis of publicly available
information, internally developed data
and other sources believed to be reliable. The sponsors, the Investment Manager, the
Trustee or any of their directors,
employees, Associates or representatives (‘entities & their Associate”) do not assume
any responsibility for, or warrant the
accuracy, completeness, adequacy and reliability of such information. Recipients of this
information are advised to rely on
their own analysis, interpretations & investigations. Readers are also advised to seek
independent professional advice in
order to arrive at an informed investment decision. Entities & their associates
including persons involved in the preparation
or issuance of this material, shall not be liable in any way for any direct, indirect,
special, incidental, consequential, punitive
or exemplary damages, including on account of lost profits arising from the information
contained in this material.
Recipient alone shall be fully responsible for any decision taken on the basis of this
document.