
Macro and
Equity Market
Outlook
Equity Market
Outlook
GLOBAL MACRO &
MARKETS – July 2023
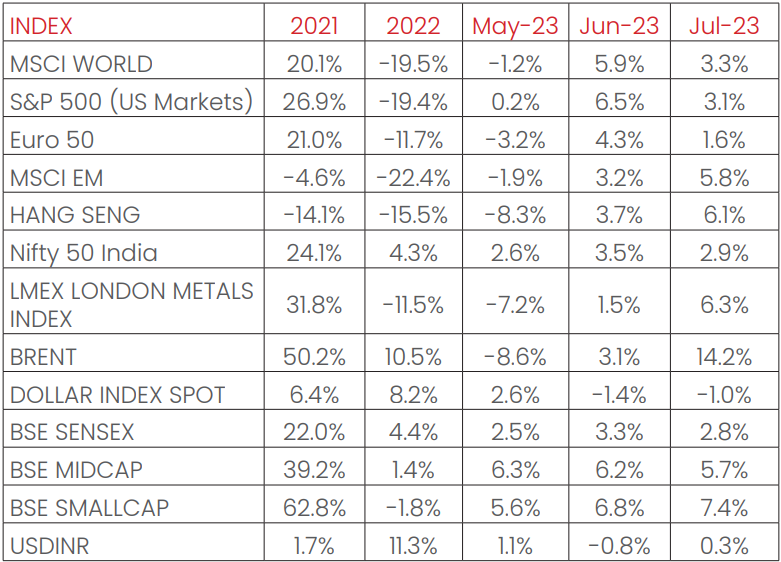
India’s NIFTY index ended the month with 2.9% gains over July. The
S&P500 (+3.1%), the Euro 50 (+1.6%), and the MSCI World (+3.3%)
were all gainers, with Japan’s Nikkei remaining broadly flat (-0.1%).
Among EM indices, the MSCI EM, the HANG SENG, BOVESPA Brazil, and
the MOEX Russia, all recorded positive month over month growths
in July, of +5.8%, +6.1%, +3.3% and +9.9% respectively. LME Metals
Index surged by +6.3%, owing to expectations of fiscal support via
stimulus from China’s central government, augmented by a
marginally weaker dollar and dull economic activity data from
China.
WTI and Brent Crude soared up in June, by +15.8% and +14.2%
respectively, as Brent Crude notched up its steepest monthly gains
since January 2022, as the market tightened post OPEC+
(Organization of the Petroleum Exporting Countries plus) supply
cuts, even as the demand outlook remained stable. The Dollar
index weakened by -1.0% over the month, with the Dollar
depreciating by -0.4% vis-à-vis EM currencies and appreciating by
+0.3% against the Indian Rupee. India 10Y G-Sec ticked upwards by
6 bps, while the USA’s 10Y G-Sec yields rose by 12 bps, and the
German Bund rose by 10 bps, with rates settling at 7.18%, 3.95% and
2.49% respectively.
Domestic Macro & Markets - July 2023
The BSE SENSEX (+2.8%) rose in July, in tandem with other Indian
indices. BSE Mid-cap and small-cap indices outperformed the
SENSEX and were up +5.7% and +7.4%, respectively. Sector-wise, all
sectors barring consumer durables ended the month in green, with
PSUs, Power and realty witnessing the largest growths of +9.3%,
+9.2% and +9% respectively. Consumer durables marginally fell,
with a -0.3% degrowth.
Rallies in Indian indices were partly driven by FII flows, as FIIs
continued to be net buyers of Indian equities in July, albeit at a
lower quantum (+$4.2 Bn, following +$5.3 Bn in June). DIIs turned
into net sellers of Indian equities (-$0.3 Bn, down from +$0.5 Bn from
last month).

India's high frequency data update:
Elevated levels of GST collections, tolerable retail inflation, deflated
input inflation, rising core sector outputs, and elevated credit growth
augurs well for the Indian economy.
India PMI:
Manufacturing PMI in July 2023 came in at 57.7, down to a 3-month
low, and remained in expansion zone (>50) for the 25th straight
month, sustained by new orders growth at its highest since November
2022. Input cost inflation hit a 9-month high but remained well below
the series average. Lead times shortened for the fifth month
sequentially. Indian Services Purchasing Manager's Index (PMI) surges
ahead to 13 years high level of 62.3 supported by robust domestic and
export demand. Composite PMI also came in at 13-year high reading
of 61.9!
GST Collection:
Collections of INR 1.65 Tn (+11% YoY) in July 2023 concluded the
seventeenth consecutive month of collections over the INR 1.4 Tn
mark, following record collections of INR 1.87 Tn in April 2023. This is
the fifth time that GST collections crossed the INR 1.6 Tn mark since
the inception of the system 6 years ago. The MoM and YoY rise in
collections was owed to rises in domestic transactions (Including
import of services) (+15% growth YoY). Rising compliance, boosted
economic activity and improved consumer spending are key
proponents of sustained GST collections.
Core sector production:
Core sector production growth accelerated to 8.2% in June 2023,
against a 5% growth in May 2023, owing to an expansion in seven of
the eight component sectors. Production of Coal, Fertilizers, Steel,
refinery products, electricity, natural gas, and Cement rose by 9.8%,
3.4%, 21.9%, 4.6%, 3.3%, +3.6% and 9.4% YoY respectively. Crude oil was
the only component that declined, by -0.6%.
Industrial Production:
Factory output as measured by the IIP index rose MoM by 5.2% YoY
in May 2023 vs a growth of 4.5% YoY in April 2023. Mining output rose
+6.4% while power generation grew by 0.9% YoY in May 2023.
Credit growth:
Credit growth reached over 14% YoY as of 14th July 2023 against YoY
growth of 12.9% as observed on 15th July 2022.
Inflation:
June 2023’s CPI inflation rate rose for the first time in five months
4.81% from 4.25% in May 2023, led by an unsupportive base, and
rising food inflation rates (+4.49%). The rate remains below the RBI’s
upper tolerance band of 6%. WPI inflation continued to drop for the
thirteenth straight month, with the June 2023 print at -4.12%, 54 bps
down from May 2023’s at -3.58%, as a favourable base effect came
into play for manufactured goods, fuel and primary articles. This
was the lowest print witnessed since October 2015.
Trade Deficit:
Indian Merchandise Exports recorded a decline of -22% YoY to
$32.97 Bn in May 2023, while Imports growth declined by -17.5%%
YoY to $53.10 Bn. India’s trade deficit narrowed by 8.7% to $20.13 Bn.
Exports lowered to a 8-month low, as global demand weakened.
Monthly Performance for Key Indices:
Note: Market scenarios are not the reliable indicators for current or future
performance. The same should not be construed as
investment advice or as any research report/research recommendation.
Past performance may or may not be sustained in future.
Source: Bloomberg
Past performance may or may not be sustained in future.
Source: Bloomberg
Market View
Higher interest rates have weighed on the global growth prospect.
While the inflation may have peaked out globally, but with the
elevated levels markets may look for clarity on Central Banks’
stance on the direction of interest rates.
Domestic macro trends have been resilient despite global
uncertainty. Green shoots are visible on the industry Capex recovery
which may be supported by Production Linked Incentive (PLI),
Localization, China+1. India’s external sector situation continues to
improve led by strong services exports and lower imports. While
revenue growth is still muted for FMCG (Fast-moving consumer
goods) companies, with a low base effect coming into play from
next 2 quarters, revenue uptrend should look better in H2. We have
also seen a sharp recovery in monsoon after a weak start. Pan India
deficit has materially reduced led by monsoon coverage in Western
and Northern regions.
India’s tax collections to GDP, credit to GDP and most importantly
rising corporate earnings to GDP reflect transparency and
formalisation reforms undertaken in the pre-pandemic period.
While valuations remain challenging in the near term. We believe
medium to long term opportunities remain strong for India and will
be driven by investment cycle & policy reforms.
We suggest investors should have a long-term orientation for
equity investments and should consider products based on their
investment goals and risk appetite. Investors can look to invest in a
staggered manner to ride the near-term uncertainties.
Conservative investors may consider asset allocation strategies.
Note: The sectors mentioned are not a recommendation to buy/sell in the said sectors.
The schemes may or may not have future
position in the said sectors. For complete details on Holdings & Sectors of NIMF schemes, please visit
website mf.nipponindiaim.com.
Past performance may or may not be sustained in future
Past performance may or may not be sustained in future
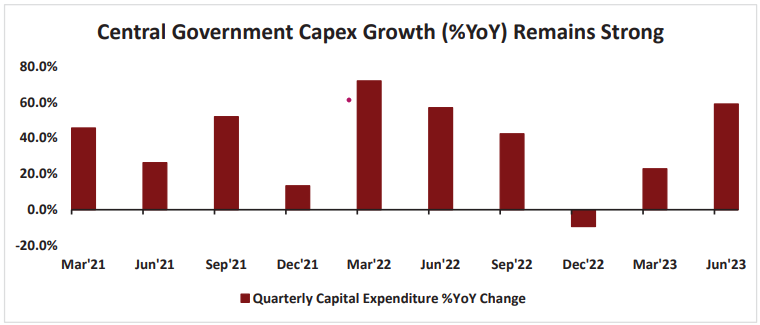
Chart of the month :
The Central Government’s quarterly capex growth (YoY%) is picking
up and remains strong, on a YoY (%) and QoQ (%) basis, with the
latest figure (Q1FY24) coming in at ~59%YoY. This bodes well for
infrastructure related segments of the economy.
Common Source:
NIMF Research, CMIE, Bloomberg
Disclaimer: The information herein above is meant only for general reading purposes and
the views being expressed only
constitute opinions and therefore cannot be considered as guidelines, recommendations or as a
professional guide for
the readers. The document has been prepared on the basis of publicly available information, internally
developed data
and other sources believed to be reliable. The sponsors, the Investment Manager, the Trustee or any of
their directors,
employees, Associates or representatives (‘entities & their Associate”) do not assume any responsibility
for, or warrant the
accuracy, completeness, adequacy and reliability of such information. Recipients of this information are
advised to rely on
their own analysis, interpretations & investigations. Readers are also advised to seek independent
professional advice in
order to arrive at an informed investment decision. Entities & their associates including persons
involved in the preparation
or issuance of this material, shall not be liable in any way for any direct, indirect, special,
incidental, consequential, punitive
or exemplary damages, including on account of lost profits arising from the information contained in
this material.
Recipient alone shall be fully responsible for any decision taken on the basis of this document.