
Macro and
Equity Market
Outlook
Equity Market
Outlook
GLOBAL MACRO & MARKETS
India’s NSE NIFTY index ended the month of July 2025 in red (-2.9%).
Among major global indices, the S&P500 (+2.2%), the Morgan
Stanley Capital International (MSCI) World (+1.2%), the Euro 50
(+0.3%), the Japanese NIKKEI (+1.4%) ended the month of July 2025
with positive returns. Performance was mixed among Emerging
Market (EM) indices as well, with the Morgan Stanley Capital
International Emerging Markets (MSCI EM), Hang Seng (Hong Kong),
BOVESPA Brazil recording sequential returns of (+1.7%), (+2.9%), and
(-4.2%) respectively.
The London Metals Exchange (LME) Metals Index fell (-2.5%) in July
2025, as global trade tensions softened. West Texas Intermediate
(WTI) and Brent Crude rose MoM, by (+6.4%) and (+7.3%),
respectively, as markets remained cautious given tariff fears and
geopolitical concerns.
The Dollar index rose (3.2%), through July 2025, with the US Dollar
(USD) depreciating vis-à-vis Emerging Market (EM) currencies
(-2.3%) and appreciating against the Indian Rupee (INR) on the
spot market (+2.2%). India 10Y G-Sec yields rose by 5 bps, while US
10Y G-Sec yields rose by 14.6 bps, and the German Bund yield rose
by 8.8 bps, with rates settling at 6.37%, 4.37% and 2.69%, respectively.
Domestic Macro & Markets
The BSE SENSEX fell (-2.9%) in July 2025, in line with the NSE NIFTY
Index. The BSE Mid-cap index and the BSE Small-Cap index
outperformed the BSE SENSEX, falling by (-2.8%), and (-2.3%) over
the month, July 2025 respectively. Sector-wise, FMCG and
Healthcare were the top outperformers over the month, clocking
(+1.6%) and (+2.5%) respectively. All except 2 of BSE’s 13 major
sectoral indices ended the month of July 2025 in red.
Net Foreign Institutional Investors (FII) flows into equities were
negative for July 2025 (at -$2.05 Bn, following +$1.69 Bn in June
2025). Domestic Institutional Investors (DIIs) remained net buyers
of Indian equities for the 23rd consecutive month (+$6.32 Bn, from
+$8.46 Bn last month, June 2025).

India's high frequency data update:
Record levels of Goods and Services (GST) collections, stable retail
inflation, deflated input inflation, rising core sector outputs, and
elevated credit growth augurs well for the Indian economy.
Purchasing Managers’ Index Manufacturing PMI:
India’s Purchasing Managers’ Index Manufacturing (PMI) in July 2025
rose to a 16-month high of 59.1 (vs 58.4 in March 2025), remaining in
expansion zone (>50) for the 47th straight month. This feat was
possible primarily due to faster increases in new orders, outputs and
stocks of purchases. The growth was associated with positive
demand circumstances and effective promotional efforts. There was
also a rise in international demand, albeit to a lesser degree.
Goods and Services Tax (GST) Collection:
Gross collections of INR 1.96 Tn (+7.5% YoY) in July 2025 concluded
the fortieth consecutive month of collections over the INR 1.4 Tn
mark, following previous record collections of INR 2.1 Tn in April 2024.
Rising compliance, higher output prices, rising collections from
imports and domestic transaction volume uptick has driven
elevated tax collections.
Core Sector Production:
The index of eight core sector industries grew by 1.7% YoY in June
2025, against a 0.7% growth in May 2025. Three out of eight
constituent segments grew YoY, driven by Steel (+9.3% YoY) and
Cement production (9.2% YoY).
Industrial Production:
Factory output growth as measured by the Index of Industrial
Production (IIP) accelerated MoM to +1.5% in June 2025, vs a growth
of +1.2% YoY in May 2025, driven by positive growths in 1 of 3 major
sectors- Manufacturing (3.9% YoY).
Credit growth:
Scheduled Commercial Bank Credit growth reached 10.2% YoY as
of 27th June 2025 against a YoY growth of 13.8% as observed on
28th June 2024, as sector-wise credit in June 2025 slowed down in
all sectors. Agriculture and allied activities credit rose by 6.8%, lower
than 17.4% a year ago, while industrial sector credit grew by 5.5%,
down from 7.7% in June 2024, the services sector credit grew by
9.6%, down from 15.1% in June 2024.
Inflation:
June’s 2025 Consumer Price Index (CPI) inflation rate decelerated
MoM to 2.1%, down from 2.8% in May 2025. Food inflation came in at
a faster pace MoM, at 1.06%, up from 0.99% in the previous month.
The Wholesale Price Index (WPI) inflation fell sequentially in June
2025, with the print at -0.13%, 295 bps down from May 2025 primarily
due to decrease in prices of food articles, mineral oils,
manufacture of basic metals, crude petroleum & natural gas etc.
Trade Deficit:
Indian Merchandise Exports fell by 0.1% YoY to $35.1 Bn in June 2025,
while Imports fell by +3.7% YoY to $53.9 Bn. Merchandise trade
deficit fell by 10.39% YoY to $18.8 Bn in June 2025.
Events to watch out for in August 2025
Trade Related News flow:
Tariff news flow remains volatile, with
changes to be monitored closely by the markets. Indian bilateral
agreements to be watched.
Earnings Season:
Quarterly earnings for Indian companies
(Q1FY26) may continue to provide colour on the global
macroeconomic backdrop for earnings based on management’s
commentary from various sectors for 2HFY26 and beyond.
Other things to watch out for:
Oil Market volatility with the
Organization of the Petroleum Exporting Countries (OPEC+)
increasing production, and Monsoon related news remain key
events for markets to watch out for.
Monthly Performance for Key Indices:
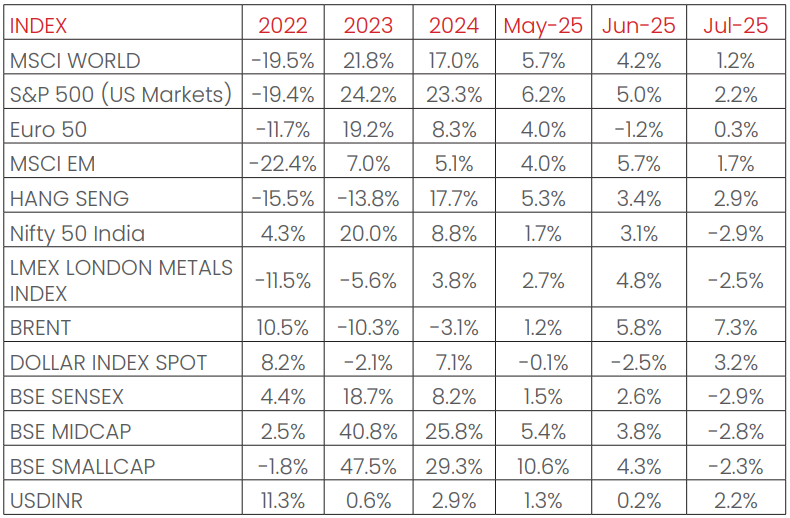
Source:NIMF Research, Bloomberg
.*Calendar year returns.
Note:Market scenarios are not reliable indicators for current or future performance. The same should not be construed as investment advice or as any research report/research recommendation
Past performance may or may not be sustained in future.
Note:Market scenarios are not reliable indicators for current or future performance. The same should not be construed as investment advice or as any research report/research recommendation
Past performance may or may not be sustained in future.
Market View
After delivering three straight months of positive returns in 2025,
the Indian market posted a negative performance in July 2025
and entered August 2025 on a cautious note.
A mix of global and domestic factors such as the release of crucial
economic data, Tariffs, global monetary policy stance,
Geopolitical Conflicts etc may shape the market movements in
the near term.
The month of August also holds significance as the market
gradually transitions into the festive season and the beginning of
the second half of FY26.
A strong monsoon and low inflation lifted the rural demand. Rural
sentiment is improving aided by higher favourable rainfall
distribution, government support, and better farm incomes.
Lower inflation and benign interest rate policy are likely to support
domestic economic recovery. Lower interest rates environment
coupled with some tax relief on consumption may help consumer
discretionary segments to perform better in the coming quarters.
Q3 FY26 onwards benefits of lower interest rates and liquidity may
have some positive effect on overall growth.
Large number of companies filing for IPOs, promoter selloffs and
Qualified Institutional Placement (QIPs) can constraint markets in
addition to modest growth recovery in the near term.
Valuations remain higher than long term average for the broader
market after recent rally this along with modest Q1 earnings point
to limited headroom. Going forward Earnings recovery in the
festive season (Q2 onwards) is expected to be a key a trigger for
the market direction.
Large Cap & Large Cap oriented diversified strategies along with
hybrid funds appear better placed on risk-reward basis, while
Mid/Small cap allocation may be considered in a staggered
manner through systematic investment with a long-term view.
Overall, given the current global shifts/uncertainties, the slower
pace of domestic growth and premium valuations, the near-term
volatility may be higher wherein disciplined investing coupled with
appropriate asset allocation may help to optimize the risk return.
Chart of the Month:
The Indian Rupee (INR) is close to being the cheapest on a
CPI-based REER (Real Effective Exchange Rate) in over five years.
Despite high tariffs, INR fundamentals have improved since 1QCY25.
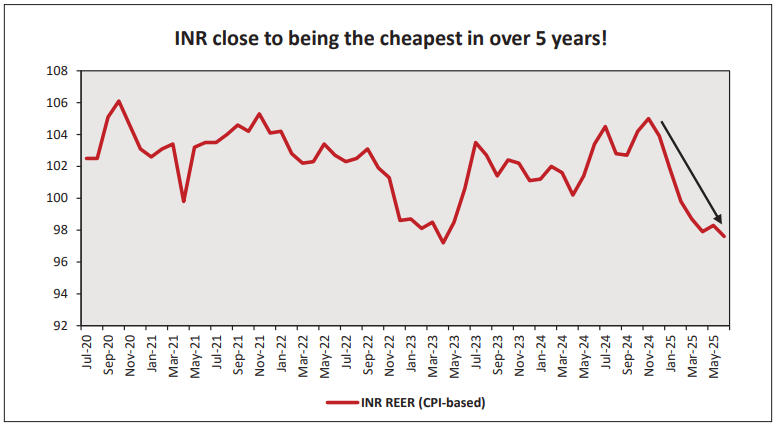
Source:
RBI, NIMF Research
Note:
All data as on 31st July, 2025 unless mentioned otherwise
Disclaimer:
The current fund philosophy may change in future depending on market conditions or fund manager’s
views. The
sectors mentioned are not a recommendation to buy/sell in the said sectors. The scheme may or may not
have future
position in the said sectors.
The information herein above is meant only for general reading purposes and the views being expressed
only constitute
opinions and therefore cannot be considered as guidelines, recommendations or as a professional guide
for the
readers. The document has been prepared on the basis of publicly available information, internally
developed data and
other sources believed to be reliable. The sponsors, the Investment Manager, the Trustee or any of
their directors,
employees, Associates or representatives (‘entities & their Associate”) do not assume any
responsibility for, or warrant
the accuracy, completeness, adequacy and reliability of such information. Recipients of this
information are advised to
rely on their own analysis, interpretations & investigations. Readers are also advised to seek
independent professional
advice in order to arrive at an informed investment decision. Entities & the associates including
persons involved in the
preparation or issuance of this material, shall not be liable in any way for any direct, indirect,
special, incidental,
consequential, punitive, or exemplary damages, including on account of lost profits arising from the
information
contained in this material. Recipient alone shall be fully responsible for any decision taken on the
basis of this document