
Macro and
Equity Market
Outlook
Equity Market
Outlook
Global Macro & Markets – Nov 2022
Indian markets rose for a second straight month in November to
new record high, but at a slower pace than global peers. Major
indices broadly rose over the month, except for BOVESPA Brazil
(-3.1%). The S&P500 (5.4%), the Euro 50 (9.6%), the MSCI World (6.8%)
and the Nikkei (1.4%) witnessed consecutive monthly rise in
November. Additionally, the MSCI EM, Hang Seng, NIFTY 50 India and
MOEX Russia all rose 14.6%, 26.6%, 4.1%, and 0.4% MoM respectively.
LME Metals Index witnessed a rise of 12.5% MoM owing to a weaker
dollar. Dollar index fell by 5% over the month, notching its biggest
monthly loss since 2010. WTI and Brent crude fell by -6.9% and -9.9%
MoM as well. US, India, and Germany 10Y G-Sec rates fell by 43, 20
and 21 bps MoM and settled at 3.61%, 7.25% and 1.93%, respectively.
Domestic Macro & Markets - Nov 2022
SENSEX rose by 3.9% in November. Mid-cap and small-cap indices
underperformed large-cap and were up 2% and 3% respectively. Of
the sectoral indices, Metals (6.5%), Oil and Gas (5.8%), and IT (5.5%)
indices were the top gainers, with the Auto (-1.1%), Consumer
Durables (-2.7%), and Power indices (-3.5%) falling MoM. Market
breadth improved over the month with 88% of NIFTY stocks trading
above their respective 200-day moving averages on December 1st,
2022. FPIs bought US$3.6 bn worth of Indian equities, while DIIs sold
US$300 mn in November.

India's high frequency data update:
Indian macro dataflow remained strong on balance.
Manufacturing PMI:
Manufacturing PMI rose MoM in November’22, reaching 55.7, and
remained in expansion zone (>50 points) for the 17th straight
month, with a marked rise in business optimism, new orders,
including exports orders.
GST Collection:
Collections of INR 1.46 Tn (+11% YoY) in November’22 concluded the
ninth consecutive month of collections over 1.4Tn mark. Improving
tax compliance, commodity price pressure and robust consumer
demand sustainably driving the GST collections.
collections.
Core sector production:
Core sector production growth slowed to a 12-month low of +0.1%
YoY in October’22, owing to a contraction in cement, refinery
products and natural gas production, which shrank for a fourth
successive month.
Industrial Production:
Manufacturing IIP rose by 3.1% YoY in September’22 vs a -0.7%
contraction in August’22.
Credit growth:
Credit growth accelerated to 17% YoY as of 4th November 2022
against YoY growth of 6.1% as observed on 5th November 2021.
Inflation:
October’22 CPI inflation fell to 6.8% from 7.4% in September’22, led
by still elevated food prices. WPI inflation continued to fall sharply
with the October’22 print at 8.4%YoY, 230 bps down from
September 2022’s at 10.7%YoY reading.
Trade Deficit:
Indian goods exports declined by 16.7% MoM to $29.78 Bn in
October’22, while imports declined by 6% to $56.69 Bn. India’s trade
deficit widened to $26.9 Bn from $25.71 Bn in September’22.
India's Q2 FY23 GDP Grows At 6.3%:
Indian 2QFY23 (July-September) GDP growth moderated to a
normal rate of 6.3% vs a 13.5% growth in the previous quarter
(April-June). GDP had expanded by 8.4% in 2QFY22. Construction
grew 6.6%yoy while public administration, defence & other services
rose 6.5%yoy. Electricity, gas, water supply & other utility services
climbed 5.6% and agriculture, forestry & fishing segment witnessed
a 4.6% rise in Gross Value Added (GVA). The GVA in the
manufacturing sector contracted 4.3% during the quarter, with
mining also declining by 2.8% YoY. Nominal GDP growth remained
strong as GDP deflator grew by over 9%yoy. Notably, India
remained the fastest-growing major economy in July to
September period.
Market View
Global macros continue to remain uncertain as counter inflationary
steps like higher interest rates, lower liquidity are likely to result in
weaker growth and impact demand across the globe. However, on
positive note the growth concerns have led to cool off in the
commodity prices including crude, which bodes well for India.
Both from cyclical and structural perspective India is better placed
vs the rest of the World. Domestic high frequency indicators
remained resilient despite the global headwinds. Policy reforms,
huge under investments in Capex, stronger corporate Balance
Sheets alongside a transition to a multipolar world may aid
manufacturing, exports and capex - creating a virtuous cycle of
growth. However, near term global uncertainties are unlikely to
wither away soon. The anticipated global slowdown, rising energy &
interest costs may lead to higher than usual volatility especially in
the short run.
We are attempting to maintain balanced portfolios through a
combination of domestic recovery themes along with secular
businesses. The attempt is to identify relatively better valued
opportunities across these themes.
From an investor’s perspective given the external risks and its
potential impact investing in a staggered manner or systematic
route may help iron out market extremes. Given our view that
broader markets can do well with the present fundamentals,
long-term investors can consider diversified strategies like
multi-cap or flexi-cap offerings for equity investments.
Conservative investors seeking equity exposure with lower volatility
may consider asset allocation strategies like - Balanced
Advantage/Asset Allocator which manage equity allocations
dynamically.
Note:The sectors mentioned are not a recommendation to buy/sell in the said sectors.
The schemes may or may not have future
position in the said sectors. For complete details on Holdings & Sectors of NIMF schemes, please visit
website mf.nipponindiaim.com.
Past performance may or may not be sustained in future
Past performance may or may not be sustained in future
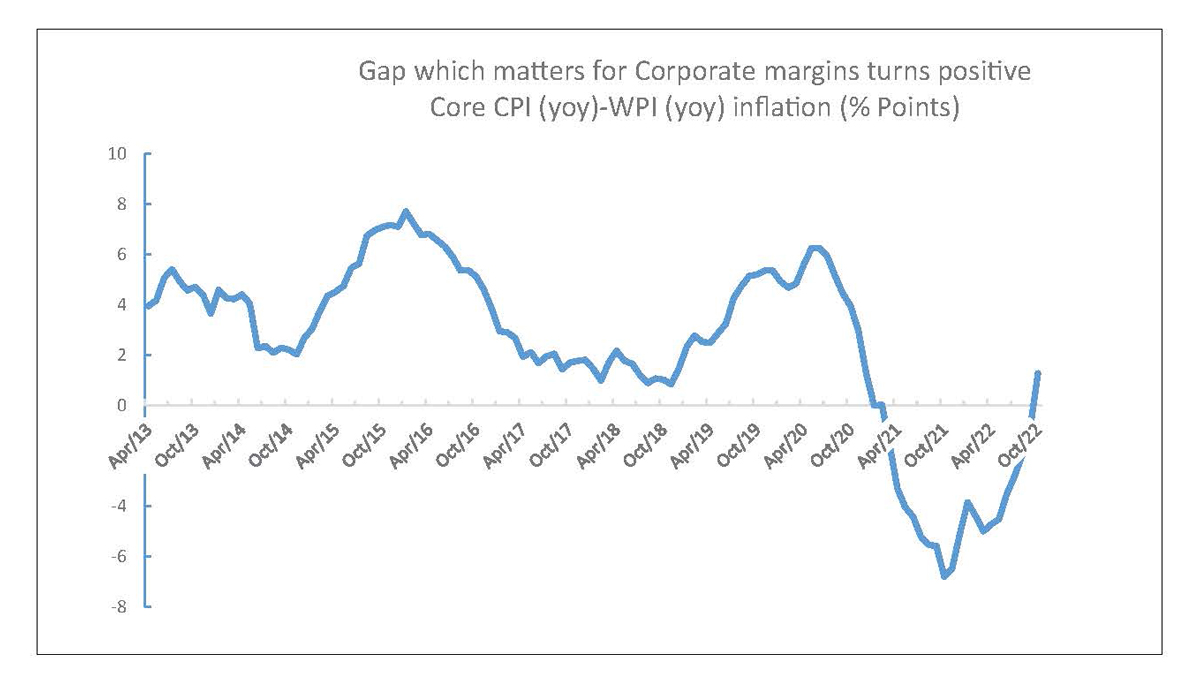
Chart of the month :
Rising cost pressures cool as the gap between Core CPI Inflation
and Core WPI inflation turns positive in October’22 (1.3%).
Common Source:
CMIE, Nippon India Mutual Fund Research, Bloomberg
Disclaimer:The information herein above is meant only for general reading purposes and
the views being expressed only
constitute opinions and therefore cannot be considered as guidelines, recommendations or as a
professional guide for
the readers. The document has been prepared on the basis of publicly available information, internally
developed data
and other sources believed to be reliable. The sponsors, the Investment Manager, the Trustee or any of
their directors,
employees, Associates or representatives (‘entities & their Associate”) do not assume any responsibility
for, or warrant the
accuracy, completeness, adequacy and reliability of such information. Recipients of this information are
advised to rely on
their own analysis, interpretations & investigations. Readers are also advised to seek independent
professional advice in
order to arrive at an informed investment decision. Entities & their associates including persons
involved in the preparation
or issuance of this material, shall not be liable in any way for any direct, indirect, special,
incidental, consequential, punitive
or exemplary damages, including on account of lost profits arising from the information contained in
this material.
Recipient alone shall be fully responsible for any decision taken on the basis of this document.