
Macro and
Equity Market
Outlook
Equity Market
Outlook
Global Macro & Markets
Even amid concerns over surging cases of a more
virulent Omicron variant, rising inflation and the
hawkish tone by global central banks, MSCI World
and MSCI EM delivered 4.2% and 1.6% respectively
over the month in December 2021. Euro-50 (+5.8%)
led the DM rally followed by S&P 500 (+4.4%) and
NIKKEI (+3.5%). While almost all markets globally
ended higher than previous month, MOEX Russia
(-2.7%) and Hang Seng (-0.3%) dragged the EM
index. Commodities had a good month as fear
over the impact of Omicron on the global
economy receded, with early data suggesting it
causes a milder illness versus previous variants
like Delta. LME Metals index jumped 4% while Brent
Crude oil gained over 10% MoM.
Domestic Macro & Markets
SENSEX and NIFTY both settled with over 2% gain each. While BSE
MidCap index (+1.1%) lagged, BSE SmallCap index (+5.4%) continued
its outperformance over the narrow index. Among sector indices, IT
(+10%), Industrials (+5%) and Discretionary (+3%) outperformed the
index while Energy (-1%), Financials (-1%) and Staples (0%) lagged
the most. Market breadth declined in November with only 50% of
BSE 200 stocks trading above their respective 200-day moving
averages. FPIs sold US$3.5 bn of Indian equities in the secondary
market while DIIs bought US$4 bn.

India's high frequency data update:
With real GDP now above pre-COVID levels, GST collections at all
time highs, manufacturing activity expanding and inflation settling
at moderate levels, macro data has been quite encouraging over
the month.
Manufacturing PMI:
Manufacturing PMI continued to remain expansionary at 55.5 in
December’21, albeit slowly though when compared to 57.6 in
November’21. International demand for Indian goods continued to
improve in December as new export orders rose for the sixth month
in succession.
GST Collection:
Collections at INR 1.3 Tn (+13% YoY) in December’21 were in line with
the collections of INR 1.32 Tn in November’21 and INR 1.3 Tn in
October’21.
Power consumption:
Power consumption in the month of December’21 was 2.8% higher
than December’20 and 8% higher than the consumption in
December’19.
Core sector production:
Core sector production rose 3.1% YoY in November’21 as against a
YoY rise of 7.5% in October’21 and decline of 1.1% in November last
year.
Industrial Production:
Manufacturing IIP rose 2% YoY in October’21 vs a rise of 4.5% in
October last year.
Credit growth:
Credit growth inched up to 7.3% YoY as of 3-Dec’21 against YoY
growth of 5.7% as observed on 4-Dec’20. Aggregate deposit growth
declined to 9.4% YoY.
Inflation:
CPI inflation in November’21 increased to 4.9% from 4.5% on the
back of higher food prices and core inflation rising from 6% to 6.3%
sequentially. WPI inflation came at a decadal high of 14.2% as fuel
and power inflation rose sharply to 39.8%.
Trade Deficit:
November’21 trade deficit rose to US$22.9 bn as compared to
US$19.9 bn in October’21. Exports increased 27.2% YoY to US$30 bn
while imports increased by 56.6% YoY to $52.9 bn.
Balance of Payments (BOP):
The current account registered a deficit of US$9.6 bn (1.3% of GDP)
in 2QFY22 against a surplus of US$6.5 bn in 1QFY22 (0.9% of GDP)
and surplus of US$15.3 bn (2.4% of GDP) in 2QFY21. The deficit was led
by a widening of the trade deficit to US$44.4 bn (1QFY22: US$30.7
bn) and an increase in net investment income outflow of US$10 bn
(US$7 bn in 1QFY22).
Year in Review
Indian Market was one of the best performing Emerging Markets in
2021. The Nifty Index was up 22.4% in US$ terms and 24.1% in INR
terms, touching an all-time high level in October and
outperformed the MSCI EM Index by over 29%. Mid-cap and
Small-cap indices returned over 46% and 59% respectively over the
year. INR remained range bound and depreciated 1.7% to close at
Rs.74.3/US$. India 10Y bond yield jumped to 6.45% in Dec’21 from
5.87% a year back . FPIs sold US$7 bn in CY2021 while DIIs bought
US$12 bn in CY2021.
Market View
Concerns on emergence of a new variant has led to higher volatility
across the globe. Also, some indicators suggest that global growth
may be slower. However, we believe that if the impact of new virus
strain is controlled, Indian recovery is likely to be in line with
expectations supported by strong earnings growth, capex revival
etc.
We believe all three market cap segments (Large, Mid and Small)
offer similar risk reward, making a case for diversified strategies with
investments across market caps. Conservative investors seeking
equity exposure with lower volatility may consider asset allocation
strategies like Multi Asset/Balanced Advantage etc which diversify
risk across different asset classes and/or manage equity
allocations dynamically.
Note: The sectors mentioned are not a recommendation to buy/sell in the
said sectors. The schemes may or may not have future
position in the said sectors. For complete details on Holdings & Sectors of NIMF
schemes, please visit website mf.nipponindiaim.com;
Past performance may or may not be sustained in future
Past performance may or may not be sustained in future
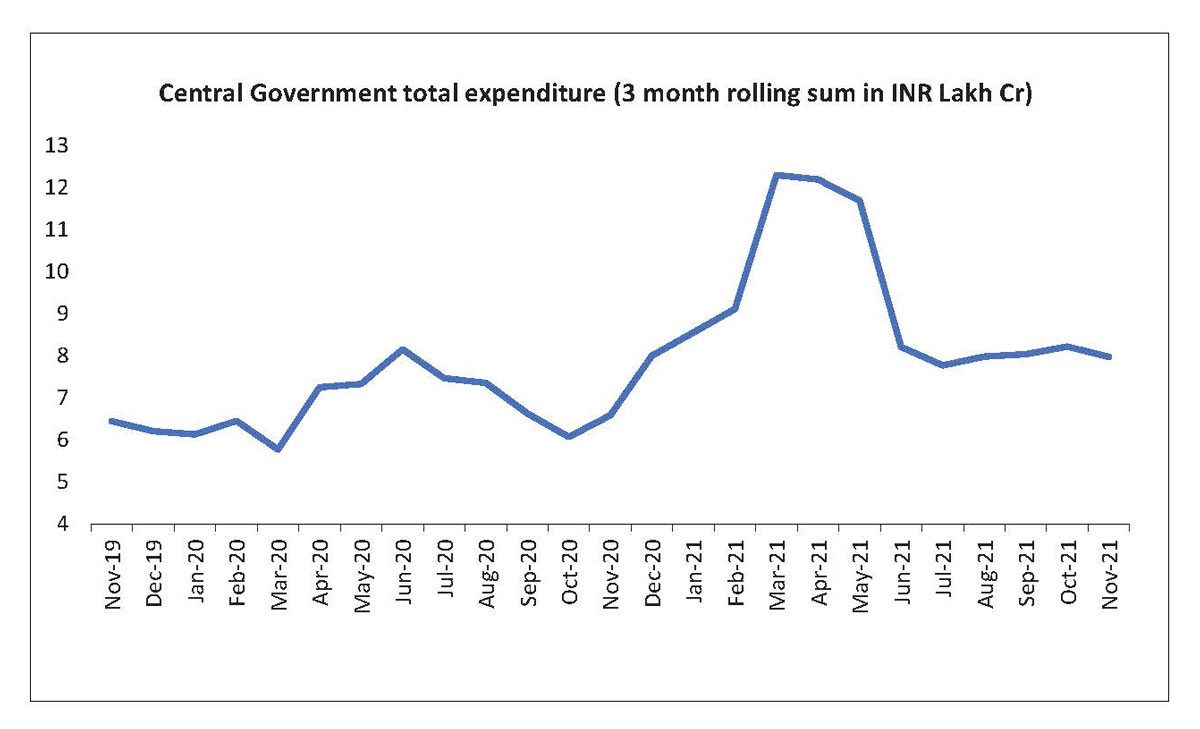
Chart of the month :
Government has been conservative in its spending so far in FY22.
Given buoyant tax revenue collections, Government may increase
spending
Common Source:
CMIE, Nippon India Mutual Fund Research, Bloomberg
Disclaimer: The information herein above is meant only for general
reading purposes and the views being expressed only
constitute opinions and therefore cannot be considered as guidelines, recommendations or
as a professional guide for
the readers. The document has been prepared on the basis of publicly available
information, internally developed data
and other sources believed to be reliable. The sponsor, the Investment Manager, the
Trustee or any of their directors,
employees, associates or representatives (“entities & their associates”) do not assume
any responsibility for, or warrant
the accuracy, completeness, adequacy and reliability of such information. Recipients of
this information are advised to
rely on their own analysis, interpretations & investigations. Readers are also advised
to seek independent professional
advice in order to arrive at an informed investment decision. Entities & their
associates including persons involved in the
preparation or issuance of this material shall not be liable in any way for any direct,
indirect, special, incidental,
consequential, punitive or exemplary damages, including on account of lost profits
arising from the information contained
in this material. Recipient alone shall be fully responsible for any decision taken on
the basis of this document.