
Macro and
Equity Market
Outlook
Equity Market
Outlook
Global Macro & Markets
Market continued to be volatile in June’22.
Investors remained concerned about global
recession amid monetary tightening due to
elevated inflation. All major global markets
declined over the month, except for Hang Seng
index (+2.1%). MSCI World index declined 8.8% in
June’22, in line with the fall in S&P500 (-8.8%) and
Euro-50 (-8.4%). MSCI EM declined 7.1%, whereas
NIFTY 50 India, BOVESPA Brazil and MOEX Russia
declined 4.8%, 11.5% and 6.4% respectively. LME
Metals Index witnessed a major fall of 14.5% MoM
owing to fears of weakening demand. Brent crude
was down 6.5% as well. Dollar index gained 2.9%
over the month. US, Germany, and India 10Y G-Sec
rates were up 17, 21 and 3 bps MoM and settled at
3.01%, 1.34% and 7.45% respectively.
Domestic Macro & Markets
SENSEX declined 4.6% in June’22. Mid-cap and small-cap indices
underperformed large-cap and were down 6.2% and 6%. On the
sectoral front, only Auto index ended in green. Metals, consumer
durable and realty indices were the biggest losers, declining 14%,
9% and 6% in June. Market breadth declined further in June’22 with
19% of BSE 200 stocks trading above their respective 200-day
moving averages. FPIs sold US$6.3 bn worth of Indian equities while
DIIs bought worth US$5.1 bn.

India's high frequency data update:
Healthy GST collections, strength within core industries,
manufacturing & agricultural sectors, resilient exports and
accelerating credit growth bode well for the economy in near term.
Manufacturing PMI:
Manufacturing PMI, though at 9-month low, continued to remain
expansionary and resilient at 53.9 in June’22.
GST Collection:
INR 1.44 Tn (+56% YoY) in June’22 recorded fourth consecutive
month of collections over 1.4Tn mark, implying healthy economic
activity and improvement in tax compliance. The growth could
also be attributed to low base (second COVID wave) and
transmission of elevated commodity prices.
Core sector production:
Core sector production rose 18.1% YoY in May’22 as against a YoY
rise of 9.3% in April’22 and a rise of 16.4% same time last year.
Growth was mainly led by petroleum refinery output up by 16.7%
and electricity output up by 22% YoY.
Industrial Production:
Manufacturing IIP increased 6.3% in April’22 vs 196% rise in April last
year.
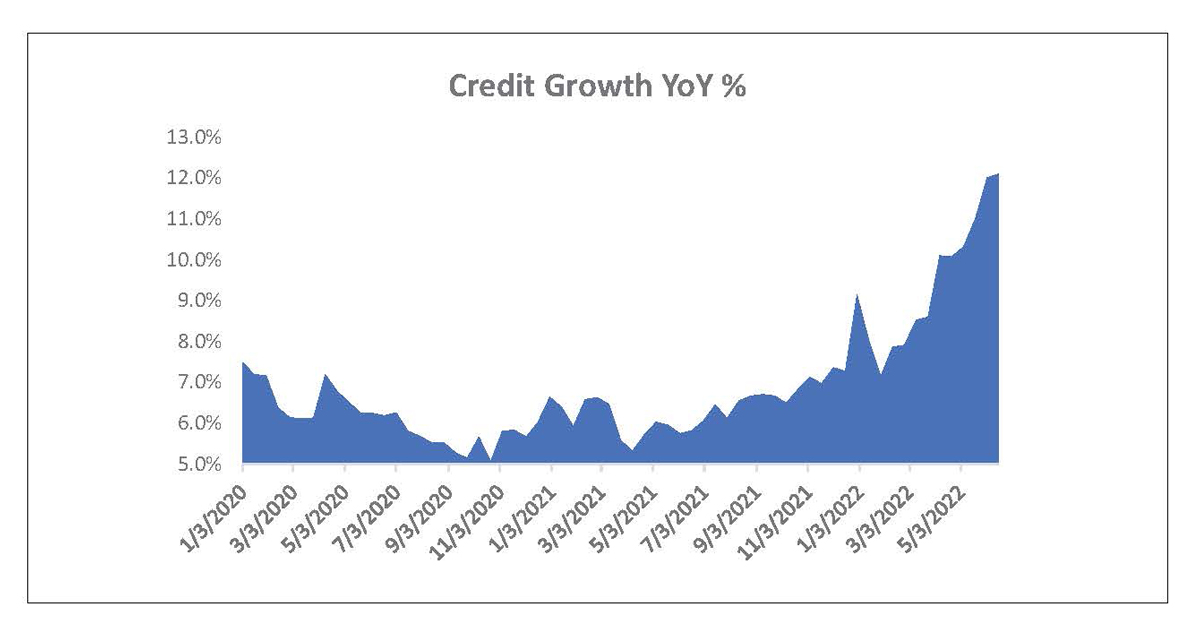
Credit growth:
Credit growth accelerated to 12% YoY as of 3-June 2022 against
YoY growth of 5.7% as observed on 4-June 2021. Aggregate
deposits also grew 9.3% YoY.
Inflation:
CPI inflation in May’22 moderated sharply to 7.04%YoY from 7.79% in
April’22 led by moderation in sequential momentum. WPI inflation
rose 80bps to 15.9%YoY.
Trade Deficit:
May’22 trade deficit widened to US$23 bn as compared to US$20.1
bn in April’22. Exports increased 15.4% YoY to US$37.3 bn while
imports increased by 56.1% YoY to $60.6 bn.
Balance of Payments:
India’s 4QFY22 current account deficit narrowed to US$13.4 bn (1.5%
of GDP), compared to US$22.2 bn in 3QFY22led by moderation in
the trade deficit to US$54.5 bn and lower net outflow of primary
income. Overall, 4QFY22 BOP was at (-)US$16 bn. FY2022 current
account reverted to deficit (1.2% of GDP) after a surplus (0.9% of
GDP) in FY2021.
RBI:
The Monetary Policy Committee (MPC) unanimously voted to raise
the repo rate by 50 bps to 4.9% while remaining focused on
withdrawal of accommodation. Consequently, Standing Deposit
Facility (SDF) rate and Marginal Standing Facility (MSF) rate
increased to 4.65% and 5.15%, respectively. Importantly, the phrase
‘remain accommodative’ has been dropped from the stance,
removing any ambiguity regarding the way forward. We see this
policy as a continuation of May’s off-cycle policy with the focus on
inflation. The MPC noted the global risks emanating from (1)
multi-decadal high inflation and slowing growth, (2) persistence of
geopolitical tensions, (3) elevated commodity prices, especially
crude oil, and (4) lingering Covid-19 related supply-chain
bottlenecks.
Market View
For the month of June investor sentiment remained subdued given
the uncertainties over a potential global recession, inflation worries
followed by monetary tightening. We believe inflation may be closer
to peaking out globally given the cool off in most of the commodity
prices except oil.
Domestic high frequency indicators remained resilient despite the
cyclical headwinds underlining the domestic recovery possibilities.
Policy reforms, huge under investments in Capex, stronger
corporate Balance Sheets alongside a transition to a multipolar
world can aid manufacturing, exports and capex - creating a
virtuous cycle of growth.
Accordingly, we are attempting to maintain balanced portfolios
through a combination of domestic recovery themes along with
secular businesses. The attempt is to identify relatively better
valued opportunities across these themes.
From an investor’s perspective given the external risks and its
potential impact investing in a staggered manner or systematic
route may help iron out market extremes. Based on the prevailing
valuations diversified funds with allocations across market cap
range may be considered from a medium-term view. Conservative
investors seeking equity exposure with lower volatility may consider
asset allocation strategies like - Balanced Advantage/Asset
Allocator which manage equity allocations dynamically.
Note:The sectors mentioned are not a recommendation to buy/sell in the said sectors.
The schemes may or may not have future
position in the said sectors. For complete details on Holdings & Sectors of NIMF schemes, please visit
website mf.nipponindiaim.com.;
Past performance may or may not be sustained in future
Past performance may or may not be sustained in future
Chart of the month :
Credit growth rose 12% YoY led by acceleration in retail loans
followed by credit offtake in MSMEs and infrastructure sub
segments
Common Source:
RBI, Bloomberg, Nippon India Mutual Fund Research
Disclaimer:The information herein above is meant only for general reading purposes and
the views being expressed only
constitute opinions and therefore cannot be considered as guidelines, recommendations or as a
professional guide for
the readers. The document has been prepared on the basis of publicly available information, internally
developed data
and other sources believed to be reliable. The sponsors, the Investment Manager, the Trustee or any of
their directors,
employees, Associates or representatives (‘entities & their Associate”) do not assume any responsibility
for, or warrant the
accuracy, completeness, adequacy and reliability of such information. Recipients of this information are
advised to rely on
their own analysis, interpretations & investigations. Readers are also advised to seek independent
professional advice in
order to arrive at an informed investment decision. Entities & their associates including persons
involved in the preparation
or issuance of this material, shall not be liable in any way for any direct, indirect, special,
incidental, consequential, punitive
or exemplary damages, including on account of lost profits arising from the information contained in
this material.
Recipient alone shall be fully responsible for any decision taken on the basis of this document.