
Macro and
Equity Market
Outlook
Equity Market
Outlook
GLOBAL MACRO & MARKETS
India’s NSE NIFTY index rebounded in June 2024, +6.6% MoM, as
Indian markets saw volatility owing to General Election results. The
S&P500 (+3.5%), the Euro 50 (-1.8%), the Morgan Stanley Capital
International (MSCI) World (+1.9%), and the Japanese NIKKEI (+2.8%)
ended the month, June 2024 with largely positive bias.
Performance was mixed among Emerging Market (EM) indices,
with the Morgan Stanley Capital International (MSCI) Emerging
Markets (EM) and the BOVESPA Brazil (BVSP) ending the month,
June 2024 in green, with returns of (+3.6%) and (+1.5%), respectively.
The HANG SENG (Hong Kong) and the MOEX RUSSIA ended the
month, June 2024 in negative, with returns of (-2.0%) and (-2.9%)
respectively.
The London Metals Exchange (LME) Metals Index fell (-4.6%) in June
2024, as market tightness slackened. The West Texas Intermediate
(WTI) and Brent Crude rose MoM, by (+5.9%) and (+5.9%)
respectively as tight supplies and Middle East tensions loomed.
The Dollar index appreciated by (+1.1%) through June 2024, with the
Dollar depreciating by (-1.6%) vis-à-vis Emerging Market (EM)
currencies and remaining flat against the Indian Rupee (INR) on
the spot market (-0.1%). India 10Y G-Sec yields rose by 3 bps, while
US 10Y G-Sec yield fell by 10 bps, and the German Bund yield fell by
16 bps, with rates settling at 7.0%, 4.4% and 2.5% respectively.
Domestic Macro & Markets
The BSE SENSEX (+6.9%) rose in June 2024, in line with the NSE NIFTY
index. BSE Mid-cap and Small-cap indices outperformed the BSE
Sensex, with growths of (+7.7%) and (+10.3%) respectively.
Sector-wise, Infotech, Teck and Realty were the top 3 performers
over the month, June 2024 clocking (+11.3%), (+9.5%), and (+8.2%),
respectively. All of BSE’s 13 sectoral indices ended the month, June
2024 in green.
Net Foreign Institutional Investors (FII) flows into equities reversed to
turn positive for June 2024 (+$ 2.91 Bn, following -$ 3.02 Bn in May
2024). The Domestic Institutional Investors DIIs remained net buyers
of Indian equities (+$3.42 Bn, from +$6.68 Bn last month). In CY2024,
Net Foreign Institutional Investors (FII) Flows stood at (+$0.14) Bn,
while net Domestic Institutional Investors (DII) investments in the
cash markets stood at (+$28.48) Bn, outpacing Foreign Institutional
Investors (FII) investments.

India's high frequency data update:
Record levels of Goods and Services Tax (GST) collections, stable retail
inflation, deflated input inflation, rising core sector outputs, and strong
credit growth augurs well for the Indian economy.
Manufacturing PMI:
India’s Manufacturing Purchasing Managers' Index (PMI) in June 2024
rose to a two-month high at 58.3 (vs 57.5 in May 2024), remaining in
expansion zone for the 35th straight month driven by manufacturing
employment accelerating and improvement in new order intakes.
Goods and Services Tax (GST) Collection:
Gross collections of INR 1.74 Tn (+7.7% YoY, slowest in 3 years) in June
2024 concluded the twenty eighth consecutive month of
collections over the INR 1.4 Tn mark, following previous record
collections of INR 2.1 Tn in April 2024. Rising compliance, higher
output prices, and domestic transaction volume uptick has driven
tax collections. However, general elections in the month in May
2024 might have impacted sequential tax collections.
Core sector production:
The index of eight core sector industries decelerated YoY to 6.3% in
May 2024, against a 6.7% jump in April 2024 (Revised upwards from
6.2%). 5 out of eight constituent segments grew YoY, driven by coal
production (10.2% YoY) and electricity generation (12.8% YoY).
Industrial Production:
Factory output growth as measured by the Index of Industrial
Production (IIP) moderated to 5% in April 2024, vs a growth of
(+5.4%) YoY in March 2024, driven by positive, but slowing YoY
growths in 3 major sectors- Mining, Manufacturing and Electricity.
Sequentially, the Index of Industrial Production (IIP) saw a
contraction of (7.6%) MoM.
Credit growth:
Scheduled Commercial Bank Credit growth reached 19.16% YoY as
of 14th June 2024 against a YoY growth of 15.42% as observed on
16th June 2023
Inflation:
May’s Consumer Price Index (CPI) inflation rate reached a
12-month low of 4.75%, decelerating from 4.83% in April 2024. Food
inflation remained flat, coming in at 7.87%. Wholesale Price Index
(WPI) inflation accelerated from April 2024, with the May 2024 print
at (+2.61%), 135 bps up from March 2024, as Wholesale Price Index
(WPI) inflation printed at a 14 month high.
Trade Deficit:
Indian Merchandise Exports rose by (+9.10%) YoY to $38.13 Bn in May
2024, while Imports rose by (+7.71%) YoY to $61.91 Bn. Merchandise
trade deficit narrowed by (-5.55%) YoY to $23.78 Bn.
Events to watch out for in July 2024:
Union Budget:
The Union Budget will be presented in the latter half of July 2024.
The finance minister presented the interim budget in February
2024 earlier this year. The upcoming budget is also expected to
address some of the demand side concerns towards the
betterment of the overall household situation. The tone and
allocation of the budget remains a key monitorable for the
markets.
Monsoon:
Till June 28 2024, cumulative rainfall was 14.5% below long-term
average (LPA) while weekly rainfall was 8.3% above long-term
average (LPA). On a cumulative basis, rainfall was above normal in
southern India while deficient in rest of India. Out of the 36
sub-divisions, till date, four have received scanty rainfall, 14 have
received deficient rainfall, 11 have received normal rainfall, and
seven have received excess rainfall.
Earnings Season:
Indian companies report earnings for Q1FY25/ Q2CY24 from the
beginning of July 2024 till the middle of August. Earnings outlook
remains buoyant amidst stable economic growth and the
upcoming union budget.
Oil Prices:
Oil demand and rising tensions in the Middle East have kept crude
prices elevated. The Organization of the Petroleum Exporting
Countries (OPEC+) cuts have also played a role. Oil prices remain
key monitorable for markets.
Monthly Performance for Key Indices:
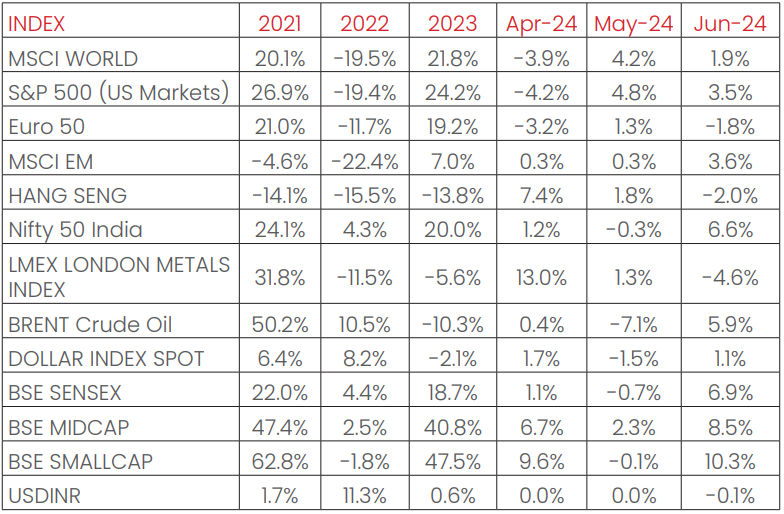
Source: Bloomberg
.*Calendar year returns.
Note:Market scenarios are not reliable indicators for current or future performance. The same should not be construed as investment advice or as any research report/research recommendation.
Past performance may or may not be sustained in future.
Note:Market scenarios are not reliable indicators for current or future performance. The same should not be construed as investment advice or as any research report/research recommendation.
Past performance may or may not be sustained in future.
Market View
India appears well-positioned with several macroeconomic
indicators, with real GDP growth surpassing expectations in FY24.
India's economy has shown remarkable resilience, with real GDP
growth surpassing expectations in FY24, including Gross Value
Added (GVA) growth, trade and fiscal deficit within limits, inflation
around 5% as on June, 2024, a good corporate earnings result
cycle and a stable currency.
A good spot in India's economic performance was the
improvement in the gross domestic savings rate as of May 2024,
which reached a nine-year high in FY24, driven by an increase in
household financial savings. This rise in savings, if channelled into
productive investments, could help support economic growth in
the future.
Investment cycle is expected to continue with greater
participation from private sector, assuming no major shifts in the
global dynamics and risk appetite.
In 2024, the corporate profit to GDP ratio stood at approx. 5% and
reached at a 15-year high as of March, 2024.
Longer term construct from a domestic growth point of view
remains positive but well captured in near term valuations.
We believe mid-teen earnings improvement is possible at a broad
level. Recovery international demand conditions and local rural
recovery can provide some upside and going forward its
estimated that market performance may be largely dependent
on earnings growth.
In our view Large Cap oriented strategies like Large/Flexi/Multi Cap
appear better placed while on the thematic space Banking &
Financial services space appears interesting on relative
valuations.
In line with the medium term perspective Mid and Small Cap
allocations in staggered manner through the systematic route.
Chart of the month :
India’s current account stood at a surplus of ~USD6bn (0.6% of GDP) in Q4FY24 as goods trade deficit shrank helped by positive seasonality effect in exports and weaker imports.
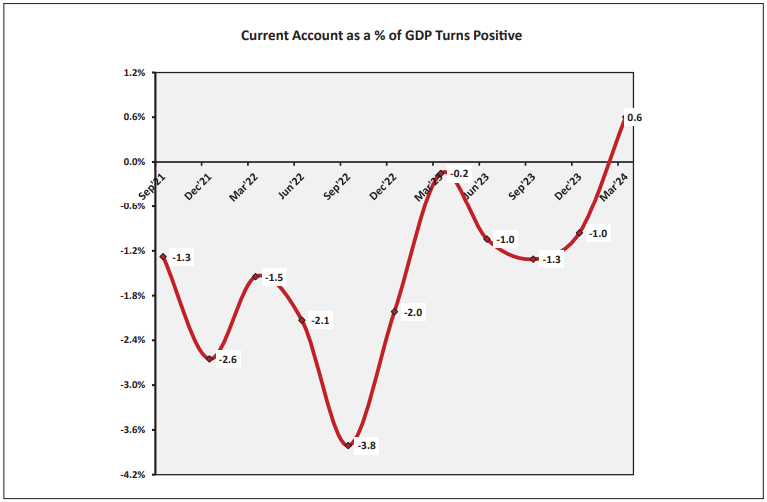
Source:
NIMF Research, CEIC
Disclaimer: The information herein above is meant only for general reading purposes and the views being expressed only
constitute opinions and therefore cannot be considered as guidelines, recommendations or as a professional guide for
the readers. The document has been prepared on the basis of publicly available information, internally developed data
and other sources believed to be reliable. The sponsors, the Investment Manager, the Trustee or any of their directors,
employees, Associates or representatives (‘entities & their Associate”) do not assume any responsibility for, or warrant the
accuracy, completeness, adequacy and reliability of such information. Recipients of this information are advised to rely on
their own analysis, interpretations & investigations. Readers are also advised to seek independent professional advice in
order to arrive at an informed investment decision. Entities & their associates including persons involved in the preparation
or issuance of this material, shall not be liable in any way for any direct, indirect, special, incidental, consequential, punitive,
or exemplary damages, including on account of lost profits arising from the information contained in this material.
Recipient alone shall be fully responsible for any decision taken on the basis of this document.
The sectors mentioned are not a recommendation to buy/sell in the said sectors. Details mentioned above are for
information purpose only.