
Macro and
Equity Market
Outlook
Equity Market
Outlook
GLOBAL MACRO &
MARKETS – May 2023
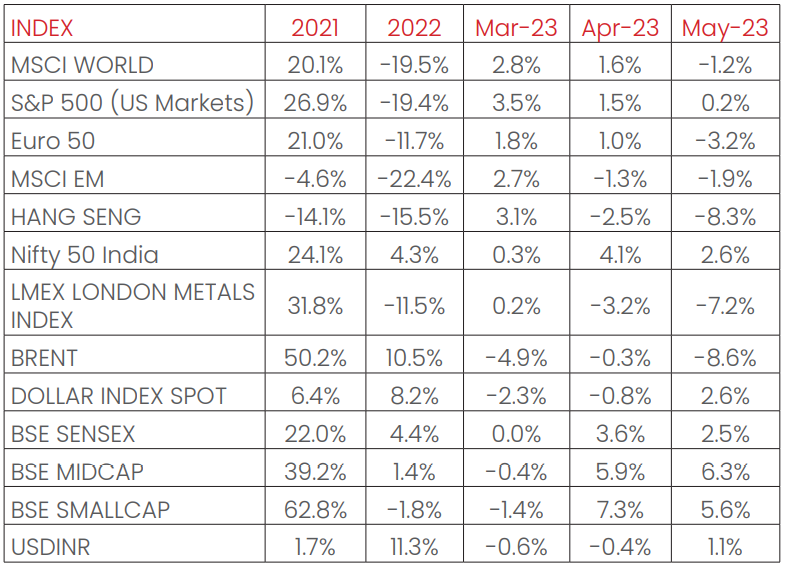
India’s NIFTY index ended the month in green in May, with a growth
of +2.6%, as major global indices ended the month with mixed
returns. The S&P500 (+0.2%) and the Nikkei (+7.0%) recorded rises
over the month, while the MSCI World (-1.2%), the Euro 50 (-3.2%)
ended the month in red as developed market indices markets
remained volatile. Among emerging markets indices, the MSCI EM
and the HANG SENG both fell by -1.9% and -8.3% respectively.
BOVESPA Brazil and MOEX Russia rose, with respective growths of
+3.7% and +3.1% MoM in May. LME Metals Index witnessed a dip, with
a -7.2% fall, owing to a stronger dollar and weak March quarter
trade data from China, which is the largest consumer of major
metals, as the market for nickel remained lackluster.
WTI fell by -11.3% and Brent Crude fell by -8.6% in May, as uncertainty
around the US debt ceiling and a clouded supply outlook from the
OPEC+ (Organization of the Petroleum Exporting Countries plus)
talks remained. The Dollar index strengthened by +2.6% over the
month, with the Dollar depreciating by -0.6% vis-à-vis the Rupee.
India 10Y G-Sec rates fell by -13 bps, while the USA’s 10Y G-Sec yields
rose by 22 bps, settling at 6.99% and 3.64% respectively, as
uncertainty around monetary policy guidance and US debt ceiling
resolutions remained. German 10Y bond yields remained stable,
falling by -3 bps over the month, sitting at 2.28%, even as Germany
officially hit recession after negative growth in the Fourth quarter of
2023.
Domestic Macro & Markets - May 2023
SENSEX (+2.5) grew in May. BSE Mid-cap and small-cap indices
outperformed large-cap indices and were up 6.3% and 5.6%,
respectively. Sector-wise, all but two sectors ended in green,
namely metals (-2.9%) and oil & gas (-1.6%). Auto (+7.9%), Realty
(+7.7%) and IT (+6.7%) indices were the largest gainers. FIIs (Foreign
Institutional Investors) continued to be net buyers of Indian equities
in May (+$4.95Bn, following +$1.9Bn in April). DIIs (Domestic
Institutional Investors) bucked their buying trend of the previous 6
months, recording negative flows (selling -$0.4 Bn).

India's high frequency data update:
Sustained high levels of GST collections, easing retail inflation, resilient
core sector outputs, and healthy credit growth bode well for the
Indian economy.
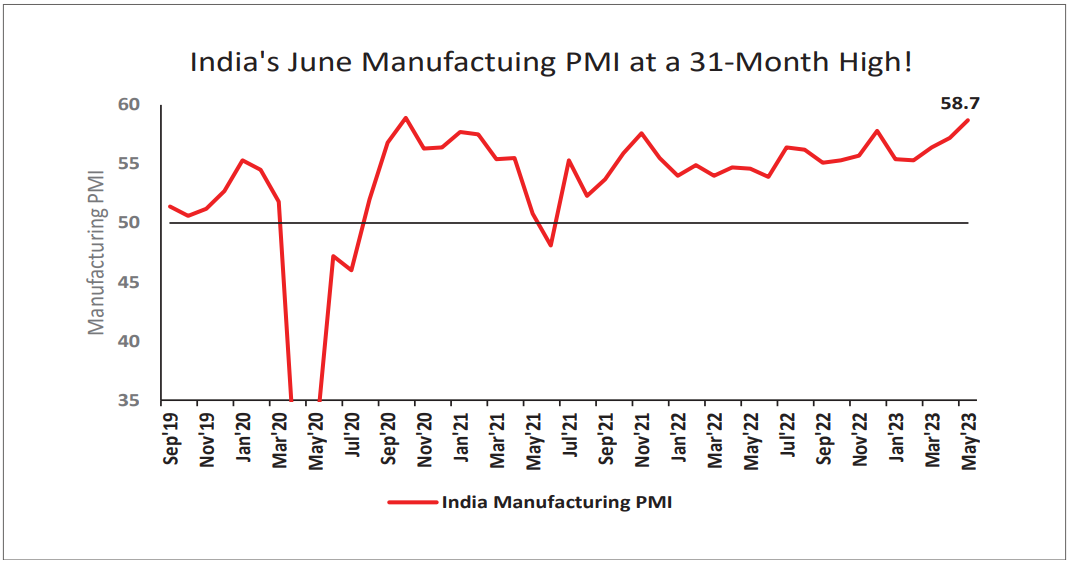
Manufacturing PMI:
Manufacturing PMI in May’23 jumped to a 31-month high, reaching
58.7, and remained in expansion zone (>50 points) for the 23rd
straight month, as output growth reached a 28-month high. New
order growth accelerated to a 25-Month high. Increases in input
buying led to sustained and boosted inventory growth. On the supply
side, input inflation remained below its long-term average, while
sentiment rose to a 5-month high.
GST Collection:
Collections of INR 1.57 Tn (+12% YoY) in May’23 concluded the
fifteenth consecutive month of collections over the INR 1.4 Tn mark,
following record collections of INR 1.87 Tn in April’23, owing to rises in
Import (+12% growth YoY) and domestic transaction revenues (+11%
growth YoY). Rising compliance, boosted economic activity and
improved consumer sentiment are key drivers of sustained GST
collections.
Core sector production:
Core sector production growth moderated MoM to a six- month
low of 3.5% YoY in April 2023, against a 3.6% growth in March 2023,
owing to a contraction in four of the eight component sectors.
Production of Coal, Fertilizers, Steel, and Cement rose by 9%, 23.5%,
12.1%, and 11.6% YoY respectively in April 2023. Natural Gas, Petroleum
Refinery Products, Crude Oil and Electricity declined by -2.8%, -1.5%,
-3.5%, and -1.4% YoY respectively in April 2023.
Industrial Production:
Factory output as measured by the IIP index growth declined MoM
by -1.1% YoY in March 2023 vs a growth of 5.6% YoY in February2023.
Mining output rose +6.8% while power generation declined by -1.2%
YoY in March 2023.
Credit growth:
Credit growth reached 15.42% YoY as of 19th May 2023 against YoY
growth of 11.14% as observed on 20th May 2022.
Inflation:
April 2023’s CPI inflation rate eased to an 18-month low of 4.76%
from 5.66% in March 2023, led by the base effect on moderating
food and energy prices. WPI inflation continued to drop for the
eleventh straight month, with the April 2023 print at a 36-month low
of -0.92%, 226 bps down from March 2023’s at 1.34%. Negative
Wholesale inflation was experienced for the first time since June
2020, as a result of easing prices across the wholesale basket and
a high base from April of last year.
Trade Deficit:
Indian Merchandise Exports recorded a decline of -12.7% YoY to
$34.66 Bn in April 2023, while Imports growth decelerated, by -14.1%
YoY to a 20-month low of $49.9 Bn. India’s trade deficit narrowed by
24.2% YoY, at $15.24 Bn from $20.11 Bn in April of 2022. For FY23,
imports rose +16.5% YoY to $ 714.2 Bn, while exports grew +6% to $
447.5 Bn, helped by a growth in shipments of petroleum products
and electronic goods.
Monthly Performance for Key Indices:
Note: Market scenarios are not the reliable indicators for current or future
performance. The same should not be construed as
investment advice or as any research report/research recommendation.
Past performance may or may not be sustained in future.
Source: Bloomberg
Past performance may or may not be sustained in future.
Source: Bloomberg
Market View
As the higher interest rates weigh on the global growth prospect,
recent events in the U.S. and European banking sectors have added
to the uncertainty. US growth is expected to moderate even further
going forward. Anticipated recovery in China post the re-opening
also seems to have slowed down. While the inflation may have
peaked out globally, but with the elevated levels markets may look
for clarity on Central Banks’ stance on the direction of interest rates.
Both from cyclical and structure perspective, India seems to be
better placed vs rest of the world. Domestic macro trends have
been very resilient despite global uncertainty. Capex has been
holding up well, government led manufacturing push has remained
robust and there are signs of increasing participation by the private
sector. We are witnessing early signs of recovery in rural demand as
well as private sector capex revival. These are the areas which may
provide support to domestic growth. While demand conditions
remain patchy, there has been some improvement from last
6-month lows. Moderating inflationary trend is a key positive. India’s
tax collections to GDP, credit to GDP and most importantly rising
corporate earnings to GDP reflect transparency and formalisation
reforms undertaken in the pre-pandemic period.
Q4FY23 results are reasonable/inline with some recovery in margins
and profitability while volume growth has been modest.
We believe volatility may continue to remain elevated in the short
term till global uncertainty abates.
Indian markets have been flattish for the last 18 months. The recent
underperformance vs global equities have made relative
valuations more favourable and in line with the historical average.
As a house we are overweight on domestic demand related sectors
as growth and earnings certainties may be higher in related
segments.
We suggest investors should have a long-term orientation for
equity investments and should consider products based on their
investment goals and risk appetite. Investors can look to invest in a
staggered manner. Conservative investors may consider asset
allocation strategies.
Note: The sectors mentioned are not a recommendation to buy/sell in the said sectors.
The schemes may or may not have future
position in the said sectors. For complete details on Holdings & Sectors of NIMF schemes, please visit
website mf.nipponindiaim.com.
Past performance may or may not be sustained in future
Past performance may or may not be sustained in future
Chart of the month :
India’s Manufacturing Purchasing Manager’s Index (PMI), as
collected and calculated by IHS (Information Handling Services)
Markit, is a metric to gauge India’s manufacturing activity through
its survey of 500 manufacturing companies. June’s Manufacturing
PMI number came in at 58.7, the highest since October 2020. This
was on the back of accelerated factory order growth (Highest
since 2021) and rising inventory stocks, as input costs continued to
ease. 28-month high Output growth and resilient demand for
Indian produced goods ensured India’s manufacturing sector
remained in expansion zone for the 23rd straight month even as
global economic growth forecasts remain tepid.
Common Source:
NIMF Research, CEIC, Bloomberg
Disclaimer:The information herein above is meant only for general reading purposes and
the views being expressed only
constitute opinions and therefore cannot be considered as guidelines, recommendations or as a
professional guide for
the readers. The document has been prepared on the basis of publicly available information, internally
developed data
and other sources believed to be reliable. The sponsors, the Investment Manager, the Trustee or any of
their directors,
employees, Associates or representatives (‘entities & their Associate”) do not assume any responsibility
for, or warrant the
accuracy, completeness, adequacy and reliability of such information. Recipients of this information are
advised to rely on
their own analysis, interpretations & investigations. Readers are also advised to seek independent
professional advice in
order to arrive at an informed investment decision. Entities & their associates including persons
involved in the preparation
or issuance of this material, shall not be liable in any way for any direct, indirect, special,
incidental, consequential, punitive
or exemplary damages, including on account of lost profits arising from the information contained in
this material.
Recipient alone shall be fully responsible for any decision taken on the basis of this document.