
Macro and
Equity Market
Outlook
Equity Market
Outlook
GLOBAL MACRO & MARKETS
India’s NSE NIFTY index ended the month higher, +1.2% MoM, in
February 2024. The S&P500 (+5.2%), the Euro 50 (+4.9%), the
Morgan Stanley Capital International (MSCI) World (+4.1%), and
the Japanese NIKKEI (+7.9%) rounded a second consecutive
positive month for major global indices. Among Emerging Market
(EM) indices, the Morgan Stanley Capital International (MSCI)
Emerging Markets, the HANG SENG (Hong Kong), The Moscow
Exchange (MOEX) Russia and the BOVESPA (BVSP) Brazil ended
February 2024 in green, with returns of +4.6%, +6.6%, 1.3%,
and +1.0% respectively.
The London Metal Exchange (LME) Metals Index was down (-1.0%)
in February 2024, as top consumer China’s demand outlook
remained moderate, with manufacturing London Metal Exchange
Purchasing Managers' Index (PMI)remaining in contraction in
February 2024. West Texas Intermediate (WTI) and Brent Crude
rose over the month, by +3.2% and +2.3% respectively as global
oil markets remained volatile based on the sustenance of The
Organization of the Petroleum Exporting Countries (OPEC+)
production caps, anticipation of US inventory data and the
situation in the Red Sea. The West Texas Intermediate (WTI)
reached the highest prices seen since November 2023.
The Dollar index strengthened by +0.9% through February 2024,
with the Dollar depreciating by -1.2% vis-à-vis Emerging
Market currencies and depreciating by -0.2% against the Indian
Rupee on the spot market. India 10Y G-Sec yields fell by -6.6
bps, while US 10Y G-Sec yield rose by +33.8 bps, and the
German Bund yield rose by +24.5 bps, with rates settling at
7.08%, 4.25% and 2.41% respectively.
Domestic Macro & Markets
The S&P BSE SENSEX (+1.2%) rose in February 2024, in line with
the NSE NIFTY Index. BSE Mid-cap index outperformed the S&P
BSE SENSEX Index, rising by +1.6%, while the BSE Small-cap
index ended the month -1% down. Sector-wise, Oil & Gas, Auto,
and Realty were the top 3 performers over the month, clocking
+6.7%, +6.4%, and +6.3%, respectively. 12 of S&P BSE’s 13
sectoral indices ended the month in green.
Net Foreign Institutional Investors (FIIs) flows into equities
were positive for February 2024 (+$0.4 Bn, following -$3.35 Bn
in January 2024). Domestic Institutional Investors (DIIs)
remained net buyers of Indian equities (+$3.06 Bn, from
+$3.3Bn last month). In CY2024, Net Foreign Institutional
Investors (FIIs) Flows stood at -$2.7 Bn, while net Domestic
Institutional Investors (DIIs) investments in the cash markets
stood at +$6.3 Bn, outpacing Foreign Institutional Investors
(FIIs) investments.

India's high frequency data update:
Elevated levels of Goods and Services Tax (GST) collections,
festive season demand uptick, stable retail inflation,
deflated input inflation, rising core sector outputs, and
elevated credit growth augurs well for the Indian economy.
Manufacturing PMI:
Manufacturing Purchasing Managers' Index (PMI) in February
2024 recovered to 56.9, at a five-month high and remained in
expansion zone for the 32nd straight month driven by
accelerating sales and new export orders.
GST Collection:
Gross collections of INR 1.68 Tn (+12.5% YoY, fourth highest
ever recorded) in February 2024 concluded the twenty fourth
consecutive month of collections over the INR 1.4 Tn mark,
following record collections of INR 1.87 Tn in April 2023.
Collections for 9 out of 10 months in this fiscal year crossed
INR 1.6 Tn. Rising compliance, increased formalization of the
economy, festive demand, and improved administrative
efficiency have driven high tax collection buoyancy.
Core sector production:
The index of eight core sector industries grew by 3.6% in
January 2024, against a 3.8% jump in December 2023, as an
unfavourable base effect came into play. Six of the eight
constituent sectors recorded positive YoY growths, with
refinery products and fertilisers recording a YoY degrowth.
Industrial Production:
Factory output growth as measured by the Index of Industrial
Production (IIP) index accelerated MoM in December 2023, with
a rise of 3.8%, vs a growth of 2.4% YoY in November 2023,
driven by muted, but positive YoY growths in all 3 constituent
sectors- Mining, Manufacturing and Electricity.
Credit growth:
Scheduled Commercial Bank Credit growth reached 20.34% YoY as
of 9th February 2024 against a YoY growth of 16.06% as
observed on 10th February 2023.
Inflation:
January’s 2024 Consumer Price Index (CPI) inflation rate
reached a 3-month low of 5.1%, decelerating from 5.69% in
December 2023. Food inflation remained elevated but falling,
coming in at 8.3%. WPI inflation reached a three month low,
with the January 2024 print at +0.27%, 46 bps down from
December’s 2023 at +0.73%, as WPI inflation printed positive
for the third month in a row.
Trade Deficit:
Indian Merchandise Exports rose by +3.13% YoY to $36.92 Bn in
January 2024, while Imports rose by +2.99% YoY to $54.41 Bn.
Merchandise trade deficit narrowed by +2.7% to $17.49 Bn as
the global economic situation remained uncertain.
Other key updates:
Earnings Season 3Q FY24:
The earnings season gone by was strong, driven by margin
tailwinds in domestic cyclicals (Autos and Financials) and
global cyclicals (Metals and Energy). A higher number of
companies in Energy, Auto, Healthcare, Industrials and
Utilities had earnings revised upwards, while IT earnings
delivery remained tepid. Interest rate and an uncertain global
economic outlook continues to drive earnings expectations,
which remained stable.
Oil Prices:
The coalition of Oil Producing and Exporting Countries (OPEC+)
rolled over its production cut policy to the second quarter of
2024, in March 2024. Current production cuts remain at 2.2 Mn
BPD (Barrels per day), with Saudi Arabia maintaining a 1 Mn
BPD voluntary cut in production till the end of June 2024.
Russia also agreed to cut its production by .47 Mn BPD until
the end of June 2024. The situation in the Red Sea and the
Israel-Hamas conflict remains an overhang for global oil
markets.
Monthly Performance for Key Indices:
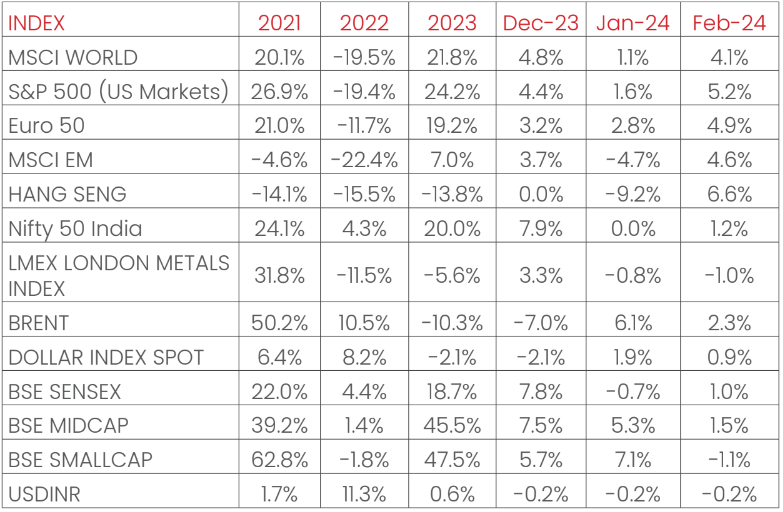
Source: Bloomberg
.*Calendar year returns.
Note: Market scenarios are not reliable indicators for current or future performance. The same should not be construed as investment advice or as any research report/research recommendation.
Past performance may or may not be sustained in future.
Note: Market scenarios are not reliable indicators for current or future performance. The same should not be construed as investment advice or as any research report/research recommendation.
Past performance may or may not be sustained in future.
Market View
India displays resilience with notable gains across major
broad based indices, reflecting positive investor sentiment
and confidence supported by demographic advantage,
deregulation & policy reforms, digitization, and demand
(aspirational spending).
The earnings season gone by was strong, driven by margin
tailwinds in domestic cyclicals (Autos and Financials) and
global cyclicals (Metals and Energy) and the overall outlook
towards domestic capital markets remains optimistic as the
earnings cycle for 3QFY24 was in line with the expectations.
Going forward the sentiment appears to be buoyant supported by
India’s relatively better macros, earnings outlook for India
remains strong relative to emerging markets, driven by healthy
credit demand and robust high-end consumption demand,
possibility of higher foreign flows and the narrative around
policy continuity in the upcoming general elections.
We believe Large Cap oriented strategies across Large Cap and
Flexi/Multi Cap categories appear to be better placed on a
risk- reward basis while Asset allocation products can help to
manage the downside risks.
Asset allocation in line with investment goals and risk
appetite is important for better risk – return optimization.
Herein asset allocation funds can help in lowering volatility
and provide better balance to the overall portfolio mix.
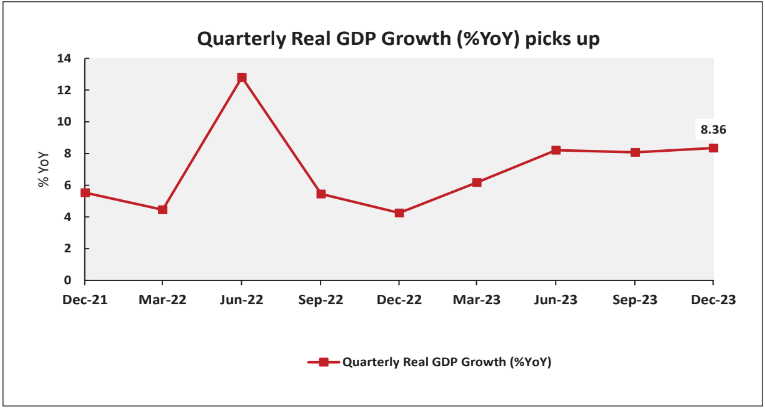
Chart of the month :
Quarterly Real GDP Growth (%YoY) picks up
India's economy rose 8.4% in the October 2023-December 2023
period, the fastest pace seen in last six quarters and partly
helped by a surge in manufacturing activity, according to data
released by the government on 29th February’2024.
Source:
MOSPI, NIMF Research, CEIC
Disclaimer: The information herein above is
meant only for general reading purposes and the views being
expressed only constitute opinions and therefore cannot be
considered as guidelines, recommendations or as a professional
guide for the readers. The document has been prepared on the
basis of publicly available information, internally developed
data and other sources believed to be reliable. The sponsors,
the Investment Manager, the Trustee or any of their directors,
employees, Associates or representatives (‘entities & their
Associate”) do not assume any responsibility for, or warrant
the accuracy, completeness, adequacy and reliability of such
information. Recipients of this information are advised to
rely on their own analysis, interpretations & investigations.
Readers are also advised to seek independent professional
advice in order to arrive at an informed investment decision.
Entities & their associates including persons involved in the
preparation or issuance of this material, shall not be liable
in any way for any direct, indirect, special, incidental,
consequential, punitive or exemplary damages, including on
account of lost profits arising from the information contained
in this material. Recipient alone shall be fully responsible
for any decision taken on the basis of this document.
The sectors mentioned are not a recommendation to buy/sell
in the said sectors. Details mentioned above are for
information purpose only.