
Macro and
Equity Market
Outlook
Equity Market
Outlook
GLOBAL MACRO & MARKETS
India’s NSE NIFTY index ended the month of February 2025 in red
(-5.9%). Among major global indices, the S&P500 (-1.4%), Morgan
Stanley Capital International (MSCI) World (-0.8%), the Euro 50
(3.3%), the Japanese NIKKEI (-6.1%) ended the month, February 2025
with largely negative returns. Performance was mixed among
Emerging Market (EM) indices as well, with the Morgan Stanley
Capital International Emerging Markets (MSCI EM), Hang Seng
(Hong Kong), the BOVESPA Brazil (BVSP) recording sequential
returns of (+0.4%), (+13.4%), and (-2.6%) respectively.
The London Metals Exchange (LME) Metals Index rose (+2.9%) in
February 2025, as aluminum and tin metals rallied. West Texas
Intermediate (WTI) and Brent Crude fell MoM, by (-3.8%) and
(-4.7%), respectively, as markets remained cautious given a
stronger dollar, and tariff fears.
The Dollar index remained flat (-0.7%), through February 2025, with
the US Dollar (USD) appreciating vis-à-vis Emerging Market (EM)
currencies (+1.1%) and appreciating against the Indian Rupee (INR)
on the spot market (+1.0%). India 10Y G-Sec yields rose by (+3 bps),
while US 10Y G-Sec yields fell by (-33 bps), and the German Bund
yield fell by (-5 bps), with rates settling at 6.73%, 4.21% and 2.4%,
respectively.
Domestic Macro & Markets
The BSE SENSEX (-5.6%) fell in February 2025, in line with the NSE
NIFTY index. The BSE Mid-cap index and the BSE Small-Cap index
underperformed the BSE SENSEX, falling by (-10.4%), and (-13.8%)
over the month, February 2025 respectively. Sector-wise, Capital
Goods, Public Sector Utilities (PSU), Realty were the top
underperformers over the month, February 2025 clocking (-14.4%),
(-13.5%), and (-13.4%), respectively. All of BSE’s 13 major sectoral
indices ended the month, February 2025 in red.
Net Foreign Institutional Investors (FII) flows into equities were
negative for February 2025 (at -$3.98 Bn, following -$9.0 Bn in
January 2025). Domestic Institutional Investors (DIIs) remained net
buyers of Indian equities for the 19th consecutive month (+$6.0 Bn,
from +$10 Bn last month, January 2025)

India's high frequency data update:
Record levels of Goods and Services Tax (GST) collections, stable retail
inflation, deflated input inflation, rising core sector outputs, and
elevated credit growth augurs well for the Indian economy.
Purchasing Managers’ Index Manufacturing PMI:
India’s Manufacturing Purchasing Managers’ (PMI) in February 2025
fell to a 14-month low of 56.6 (vs 57.7 in January 2025), remaining in
expansion zone (>50) for the 43rd straight month. New export orders
modestly declined in February 2025 from its 14-year high in January
2025 but remained strong as firms reported an increase in sales from
all regions. Among the price-related sub-indices both the input and
output price index remained in the expansionary territory, however
the pace of expansion continued to decline in February 2025 (vs.
January 2025).
Goods and Services Tax (GST) Collection:
Gross collections of INR 1.84 Tn (+9.1% YoY) in February 2025
concluded the thirty sixth consecutive month of collections over
the INR 1.4 Tn mark, following previous record collections of INR 2.1 Tn
in April 2024. Rising compliance, higher output prices, festive
season demand, rising collections from imports and domestic
transaction volume uptick has driven elevated tax collections.
Core Sector Production:
The index of eight core sector industries grew by (+4.6%) YoY in
January 2025, against a (+4.0%) growth in December 2024, as an
unfavourable base effect came into play. Six out of eight
constituent segments grew YoY, driven by Cement production
(14.5% YoY).
Industrial Production:
Factory output growth as measured by the Index of Industrial
Production (IIP) decelerated MoM to (+3.2%) in December 2024, vs
a growth of (+5%) YoY in November 2024, driven by slowing, but
positive growths in 3 of 3 major sectors- Manufacturing, Mining,
Electricity.
Credit growth:
Scheduled Commercial Bank Credit growth reached (+11.26%) YoY
as of 7th February 2025 against a YoY growth of (+20.34%) as
observed on 9th February 2024, as a strong base effect came to
play, amid changes to Reserve Bank of India (RBI’s) norms for risk
weights and changes to the Liquidity Coverage Ratio (LCR) norms.
Inflation:
January’s 2025 Consumer Price Index (CPI) inflation rate
decelerated MoM to (4.31%), down from (5.22%) in December 2025.
Food inflation came in at a slower pace MoM, at (5.68%), down from
(7.69%) in the previous month, January 2025. The Wholesale Price
Index (WPI) inflation fell sequentially in January 2025, with the print
at (+2.31%), 6 bps down from December 2024.
Trade Deficit:
Indian Merchandise Exports fell by (2.38%) YoY to $36.4 Bn in
January 2025, while Imports rose by (+10.28%) YoY to $59.42 Bn.
Merchandise trade deficit rose by (38.83%) YoY to $23 Bn.
Events to watch out for in March 2025:
High Frequency Data Revival in India:
India high frequency data
revival to be monitored by markets, namely in auto sales, Services
and Composite PMI, credit growth and residential sales data.
Government Capex:
Consumption numbers, utilization levels,
corporate spending remain key monitorables from the market’s
perspective, along with central government capex.
Other things to watch out for:
Oil Market volatility, Tariff and Heat
Wave related news remain key events for markets to watch out for.
Monthly Performance for Key Indices:
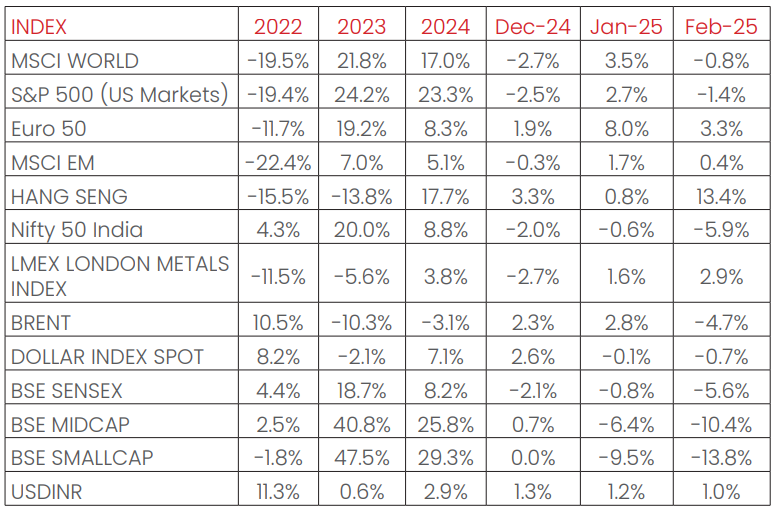
Source: Bloomberg
.*Calendar year returns.
Note:Market scenarios are not reliable indicators for current or future performance. The same should not be construed as investment advice or as any research report/research recommendation.
Past performance may or may not be sustained in future.
Note:Market scenarios are not reliable indicators for current or future performance. The same should not be construed as investment advice or as any research report/research recommendation.
Past performance may or may not be sustained in future.
Market View
Indian Equity Market correction continued across categories with
some segments seeing a fall from their recent highs.
This downturn in the equity markets is primarily attributed to global
economic factors, including Uncertainty due to US policy
environment, Interest rates challenges and above all weaker
near-term earnings in India.
3rd quarter earnings continue to remain weak and in line with the
results of the first 2 quarters. Certain segments like – Industrials,
Power, small and midcaps, etc. have sharp corrections as well.
Looking ahead the equity markets are likely to reflect the earnings
growth.
Global policy stance especially the tariff actions by the US and
responses from impacted countries is likely to impact the market
sentiments. US policy actions – especially Tariff related factors –
can lead to changes in global supply chains and can impact on
near term growth.
Large Cap & Large Cap oriented strategies along with hybrid funds
appear better placed on risk-reward basis, while Mid/Small cap
allocation may be considered in a staggered manner through
systematic investments.
Overall, we believe while the market may consolidate in the near
term the domestic fundamentals / lead indicators remain
supportive and offer reasonable possibilities from a medium-term
perspective.
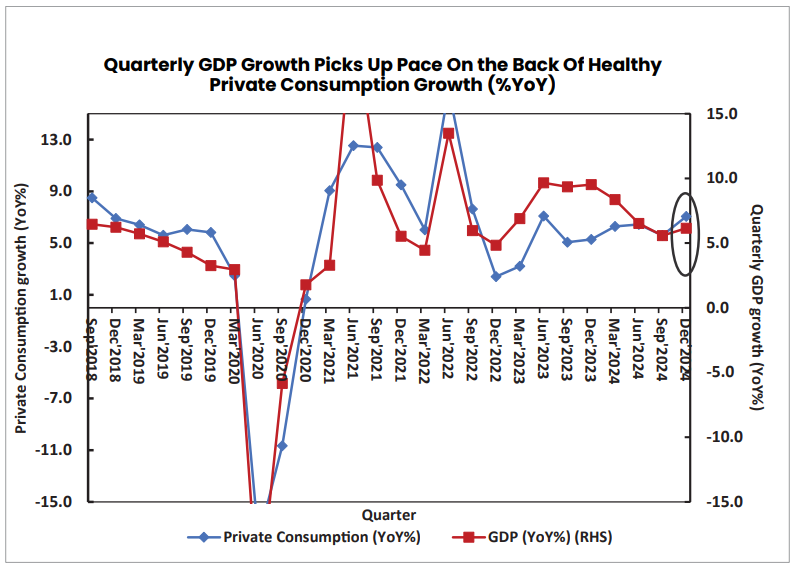
Chart of the Month:
India's Gross Domestic Product (GDP) growth picked up pace in Q3
to 6.2% with primary driver of growth being Agriculture and Services
from the supply side and Private and Government consumption
from the expenditure side. Growth for previous 2 years were revised
sharply higher to 9.2% for FY24 (from 8.2%) and 7.6% for FY23 (from
7.0% earlier). However, Q4 growth will be supported by revival in
consumption demand (especially Rural), boost from Maha Kumbh
and pick up in Government expenditure. On expenditure side,
growth was supported by improvement in private consumption
growth at 6.9% from 5.9% in Q2 and sharp pick up in government
consumption at 8.3% from 3.8% in the previous quarter. Investment
growth softened to 5.7% from 5.8% despite a sharp jump in central
government spending (47.0% YoY growth as per monthly
Comptroller and Auditor General of India (CAG report). This implies
private capex growth has remained sluggish in Q3. Private Final
Consumption Expenditure (PFCE) contributed 66.0% to GDP growth
during the quarter while Investments contributed 29.0%. Nominal
GDP growth for the quarter was 9.9%.
Source:
NIMF Research, CEIC
Disclaimer:
The information herein above is meant only for general reading purposes
and the views being expressed only constitute opinions and therefore
cannot be considered as guidelines, recommendations or as a professional
guide for the readers. The document has been prepared on the basis of
publicly available information, internally developed data and other sources
believed to be reliable. The sponsors, the Investment Manager, the Trustee
or any of their directors, employees, Associates or representatives (‘entities
& their Associate”) do not assume any responsibility for, or warrant the
accuracy, completeness, adequacy and reliability of such information.
Recipients of this information are advised to rely on their own analysis,
interpretations & investigations. Readers are also advised to seek
independent professional advice in order to arrive at an informed
investment decision. Entities & the associates including persons involved in
the preparation or issuance of this material, shall not be liable in any way for
any direct, indirect, special, incidental, consequential, punitive, or exemplary
damages, including on account of lost profits arising from the information
contained in this material. Recipient alone shall be fully responsible for any
decision taken on the basis of this document.
The sectors mentioned are not a recommendation to buy/sell in the said
sectors. Details mentioned above are for information purpose only.