
Macro and
Equity Market
Outlook
Equity Market
Outlook
GLOBAL MACRO & MARKETS – April 2023
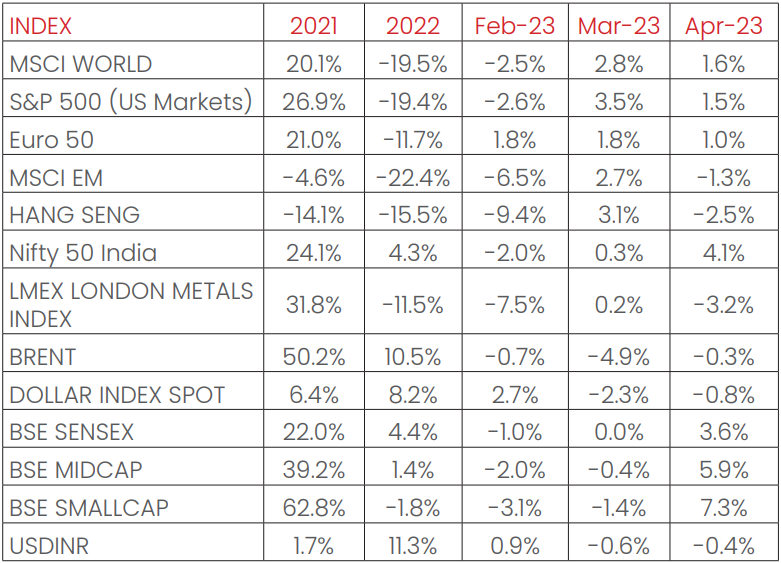
India’s NIFTY index rallied in April, ending the month with a +4.1% up,
outperforming most regional peers and major global indices.
Major indices majorly rose over the month, with MOEX Russia
leading the ascent, with a +7.5% rise. The S&P500 (+1.5%), the MSCI
World (+1.6%), the Euro 50 (+1.0%) and the Nikkei (+2.9%) ended the
month in green. Among emerging markets indices, the MSCI EM
and the HANG SENG both fell by -1.3% and -2.5% respectively.
BOVESPA Brazil rose, with a growth of 2.5% MoM in April. LME Metals
Index witnessed a dip, with a +-3.2% fall, owing to a subdued
demand recovery, a shrinkage in manufacturing activity, coupled
with persistent property developer weaknesses in China, which is
the largest consumer of major metals.
WTI rose +1.5% and Brent Crude fell by -0.3% in April, as weak
economic data from China and expectations of a rate hike by the
Federal reserve weighed in on the minds of investors globally. The
Dollar index fell by -0.8% over the month, with the Dollar
depreciating by -0.4% over the month vis-à-vis the Rupee. India 10Y
G-Sec rates fell by 19 bps, while the USA’s 10Y G-Sec yields fell by 5
bps, settling at 7.12% and 3.42% respectively, on bets of uncertain
monetary policy guidance. German 10Y bond yields remained
stable, rising 2 bps over the month, at 2.31%.
Domestic Macro & Markets - April 2023
SENSEX (+3.6) grew in April. Mid-cap and small-cap indices
outperformed large-cap indices and were up by +6.0% and +7.5%,
respectively. Sector-wise, all sectors ended in green, except IT, as
weak results subdued performance. On the sectoral front, Realty
(+14.8%), Auto (+7.4%), and PSU (+7.2%) gained the most, while IT
(-3.4%) closed in the red. FIIs (Foreign Institutional Investors)
continued to be net buyers of Indian equities in April (+$1.5Bn,
following +$1.5Bn in March). DIIs (Domestic Institutional Investors)
continued their buying trend from the previous month, recording
positive flows (+$0.27Bn).

India's high frequency data update:
Record levels of GST collections, strengthening, but moderating core,
resilient manufacturing & agricultural sector outputs, moderating
inflation and healthy credit growth bode well for the Indian economy.
Manufacturing PMI:
Manufacturing PMI in April’23 jumped to a 4-month high, reaching
57.2, and remained in expansion zone (>50 points) for the 22nd
straight month, as output and new order growth reached four-month
highs. Timely acquisitions of input inventories and sales expansion
gave an impetus to the expansion. On the supply side, input inflation
accelerated on account of transportation and raw material prices,
with sentiment and demand resilience improving from March’s eight
month low.
GST Collection:
Record collections of INR 1.87 Tn (+12% YoY) in April’23 concluded the
fourteenth consecutive month of collections over the INR 1.4 Tn
mark, owing to rises in Import and domestic transaction revenues
(16% growth YoY). Rising compliance, boosted economic activity
and improved consumer sentiment are key drivers of sustained
GST collections.
Core sector production:
Core sector production growth decelerated MoM to a five- month
low 3.6% YoY in March 2023, against a 6% growth in February 2023,
owing to an expansion in five of the eight component sectors.
Production of Coal, Fertilizers, Natural gas, Petroleum and Steel rose
by 12.2%, 9.7%, 2.8%, 1.5%, and 8.8% YoY respectively. Crude Oil,
Cement and Electricity declined by -2.8%, -0.8%, and -1.8% YoY
respectively. For FY23, core sectors recorded a 7.6% growth
compared to 10.4% in FY22, with all sectors reporting higher
production except crude oil, which shrank by -1.7%.
Industrial Production:
Factory output as measured by the IIP index growth accelerated
MoM to 5.6% YoY in February 2023 vs a growth of 5.2% YoY in
January 2023. Mining output rose +4.6% and power generation
surged +8.2% YoY in February 2023.
Credit growth:
Credit growth reached 15.71% YoY as of 7th April 2023 against YoY
growth of 9.89% as observed on 8th April 2022.
Inflation:
March’s CPI inflation rate eased to a 15-month low of 5.66% from
6.44% in February 2023, led by moderating food prices- namely
vegetables, meat, and oil, even as cereals and milk prices rose. WPI
inflation continued to drop for the tenth straight month, with the
March 2023 print at a 29-month low of 1.34%, 251 bps down from
February 2023’s at 3.85%.
Trade Deficit:
Indian Merchandise Exports recorded a decline of -13.9% YoY to
$38.4 Bn in March 2023, on account of persistent inflation and
higher borrowing costs, while Imports decreased slower, by -7.9%
YoY to $58.1 Bn. India’s trade deficit widened by 6.4% YoY $19.7 Bn
from $17.43 Bn in February of the 2023. For FY23, imports rose +16.5%
YoY to $ 714.2 Bn, while exports grew +6% to $ 447.5 Bn, helped by a
growth in shipments of petroleum products and electronic goods.
Monthly Performance for Key Indices:
Note: Market scenarios are not the reliable indicators for current or future
performance. The same should not be construed as
investment advice or as any research report/research recommendation.
Past performance may or may not be sustained in future.
Source: Bloomberg
Past performance may or may not be sustained in future.
Source: Bloomberg
Market View
As the higher interest rates weigh on the global growth prospect,
recent events in the U.S. and European banking sectors have added
to the uncertainty. However, with reopening of China, easing of the
natural gas crisis in Europe and resilient US consumer demand, it is
expected that the slowdown may not be as severe as anticipated
earlier. While the inflation seems to have peaked out globally, but
with the elevated levels markets may look for clarity on Central
Banks’ stance on the direction of interest rates.
Both from cyclical and structural perspective, India seems to be
better placed vs rest of the World. Domestic high frequency
indicators like GST collections, credit growth, Purchasing Managers'
Index (PMI), etc point to elevated activity levels. India is expected to
be one of the fastest growing economies in 2023. Policy reforms in
the recent past, Government led Capex focus, stronger corporate
Balance Sheets have potentially created a robust platform for a
virtuous multi quarter cycle of growth.
Volatility may continue to remain elevated in the short term till
global uncertainty abates.
Indian markets have been flattish for the last 18 months. The recent
underperformance vs global equities have made relative
valuations more favourable and in line with the historical average.
As a house we are overweight on domestic demand related sectors
as growth and earnings certainties may be higher in related
segments.
We suggest investors should have a long-term orientation for
equity investments and should consider products based on their
investment goals and risk appetite. Investors can look to invest in a
staggered manner. Conservative investors may consider asset
allocation strategies.
Note: The sectors mentioned are not a recommendation to buy/sell in the said sectors.
The schemes may or may not have future
position in the said sectors. For complete details on Holdings & Sectors of NIMF schemes, please visit
website mf.nipponindiaim.com.
Past performance may or may not be sustained in future
Past performance may or may not be sustained in future
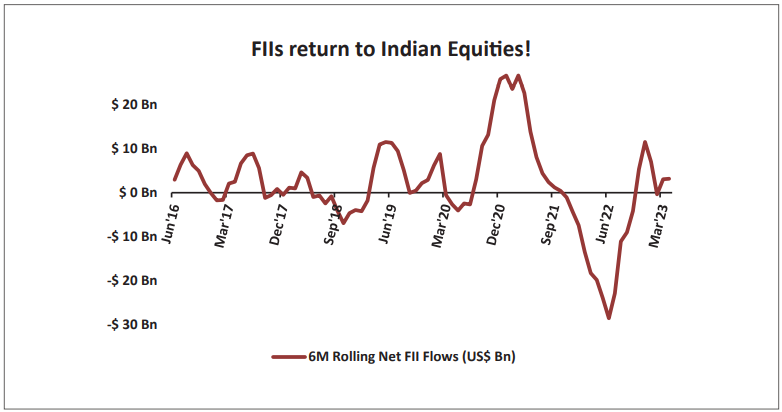
Chart of the month :
FIIs have made a foray into Indian Markets in recent months as net
inflows (on a 6m rolling basis) continue to remain healthy, as FIIs
turned net buyers for the second consecutive month in April 2023
(US$ +1.534 Bn), even as interest rates continue to rise in the USA.
Pivots to India could be based on strong economic headwinds
facing China, and disappointing US inflation data, amidst further
hawkish commentary by the Fed.
Common Source:
NIMF Research, CEIC, Bloomberg
Disclaimer:The information herein above is meant only for general reading purposes and
the views being expressed only
constitute opinions and therefore cannot be considered as guidelines, recommendations or as a
professional guide for
the readers. The document has been prepared on the basis of publicly available information, internally
developed data
and other sources believed to be reliable. The sponsors, the Investment Manager, the Trustee or any of
their directors,
employees, Associates or representatives (‘entities & their Associate”) do not assume any responsibility
for, or warrant the
accuracy, completeness, adequacy and reliability of such information. Recipients of this information are
advised to rely on
their own analysis, interpretations & investigations. Readers are also advised to seek independent
professional advice in
order to arrive at an informed investment decision. Entities & their associates including persons
involved in the preparation
or issuance of this material, shall not be liable in any way for any direct, indirect, special,
incidental, consequential, punitive
or exemplary damages, including on account of lost profits arising from the information contained in
this material.
Recipient alone shall be fully responsible for any decision taken on the basis of this document.