Macro and
Equity Market
Outlook
Equity Market
Outlook
GLOBAL MACRO & MARKETS
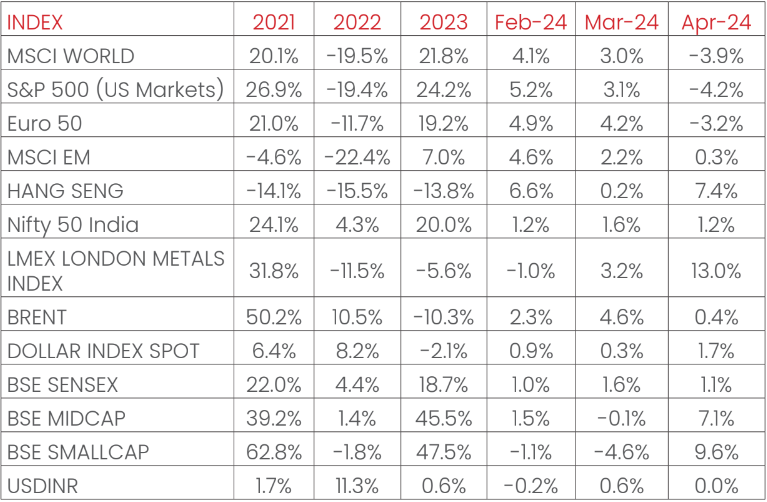
India’s NSE NIFTY index ended the month in green, up +1.2%
MoM, in April 2024. The S&P500 (-4.2%), the Euro 50 (-3.2%),
the Morgan Stanley Capital International (MSCI) World (-3.9%),
and the Japanese NIKKEI (-4.9%) all ended the month in red.
Among Emerging Market (EM) indices, the Morgan Stanley Capital
International (MSCI) Emerging Markets, the HANG SENG (Hong
Kong), The Moscow Exchange (MOEX) Russia ended April 2024 in
green, with returns of +0.3%, +7.4%, +4.1%, respectively. The
BOVESPA (BVSP) Brazil ended in negative in April 2024, with a
return of -1.7% MoM.
The London Metals Exchange (LME) Index rose (+13.0%) in April
2024, as base metals gained, it drove global demand amidst
tighter supplies. The West Texas Intermediate (WTI) fell, and
Brent Crude rose MoM, by -1.5% and +0.4% respectively as high
inventory levels drew prices lower. The Dollar index
strengthened by +1.7% through April 2024, with the Dollar
depreciating by -0.8% vis-à-vis Emerging Market (EM)
currencies and remaining flat against the Indian Rupee on the
spot market. India 10Y G-Sec yields rose by 13 bps, while US
10Y G-Sec yield rose by 48 bps, and the German Bund yield rose
by 29 bps, with rates settling at 7.19%, 4.67% and 2.58%
respectively.
Domestic Macro & Markets
The S&P BSE SENSEX (+1.1%) rose in April 2024, in line with
the NSE NIFTY index. BSE Mid-cap and Small-cap indices
outperformed the S&P BSE Sensex, with performances of +7.1%
and +9.6% respectively. Sector-wise, Metals, PSU and Power
were the top 3 performers over the month, clocking +10.8%,
+10.0%, and +7.7%, respectively. 11 of BSE’s 13 sectoral
indices ended the month in green.
Net Foreign Institutional Investors (FII) flows into equities
were negative for April 2024 (-$1.3 Bn, following +4 Bn in
March 2024). The Domestic Institutional Investors (DIIs)
remained net buyers of Indian equities (+$5.3 Bn, from +$6.78
Bn last month). In CYTD2024, Net Foreign Institutional
Investors (FII) Flows stood at +$0.04 Bn, while net Domestic
Institutional Investors (DII) investments in the cash markets
stood at +$18.36 Bn, outpacing Foreign Institutional Investors
(FII) investments.

India's high frequency data update:
Record levels of Goods and Services Tax (GST) collections,
stable retail inflation, deflated input inflation, rising core
sector outputs, and elevated credit growth may augur well for
the Indian economy.
Manufacturing PMI:
India Manufacturing Purchasing Managers' Index (PMI) in April
2024 remained strong at 58.8 (vs 59.1 in March 2024),
remaining in expansion zone for the 33rd straight month driven
by accelerating output and new orders, underpinning strong
demand conditions.
GST Collection:
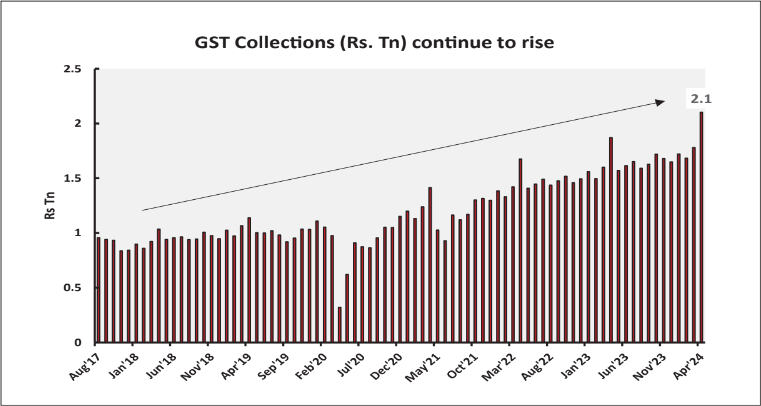
Gross collections of INR 2.10 Tn (+12.4% YoY, highest ever
recorded) in April 2024 concluded the twenty sixth consecutive
month of collections over the INR 1.4 Tn mark, following
previous record collections of INR 1.87 Tn in April 2023.
Rising compliance, increased formalization of the economy,
domestic transaction volume uptick, and growth in imports have
driven elevated tax collections.
Core sector production:
The index of eight core sector industries decelerated YoY to
-5.2% in March 2024, against a +7.2% jump in February 2024
(Revised upwards from +6.7%). Six of the eight constituent
sectors recorded positive YoY growths, with Fertilizers and
refinery outputs recording a YoY degrowth.
Industrial Production:
Factory output growth as measured by the Index of Industrial
Production (IIP) index rose to a 4-month high in February
2024, with a rise of +5.7%, vs a growth of +3.8% YoY in
January 2024, driven by positive YoY growths in 3 major
sectors- Mining, Manufacturing and Electricity.
Credit growth:
Scheduled Commercial Bank Credit growth reached 19.01% YoY as
of 19th April 2024 against a YoY growth of 15.92% as observed
on 21st April 2023.
Inflation:
March’s 2024 Consumer Price Index (CPI) inflation rate reached
a 10-month low of 4.85%, decelerating from 5.09% in February
2024. Food inflation decelerated, coming in at 8.52%.
Wholesale Price Index (WPI) inflation accelerated from
February 2024, with the March 2024 print at +0.53%, 33 bps up
from February 2024, as WPI inflation printed positive for the
fifth month in a row.
Trade Deficit:
Indian Merchandise Exports rose by +0.67% YoY to $41.67 Bn in
March 2024, while Imports fell by -5.98% YoY to $57.27 Bn.
Merchandise trade deficit widened by +17.74% YoY to $15.59 Bn
as oil exports decelerated.
Events to watch out for in May 2024
Q4FY24 Earnings Season:
The Q4FY24 earnings season continues in May 2024, against the
backdrop of a better-than-expected earnings season in the
previous quarter. Earnings in general has been better than
expected led by domestic cyclical segments. Information
Technology (IT) services and Fast-moving consumer goods (FMCG)
posted weaker than expected earnings so far. Management
commentary around the outlook for FY25 profitability is one of
the most important variables to watch out for.
General Election Developments:
Voting for Indian General Elections which started on April
19th, 2024, which will run over six weeks in seven phases.
Bulk of the polling will happen in May 2024. The third phase
for elections will start from May 7th, 2024, with a total of
92 seats across 11 Union Territories (UTs) and states going to
the polls. Policy continuation towards developmental agenda
makes the elections a key monitorable for markets.
Oil Prices:
Oil markets remain data driven, with United States (US)
economic data leading to fresh concerns over near term demand,
with aggravated crude inventories and potential easing of
geopolitical risk leading to a drop in oil prices. When The
Organization of the Petroleum Exporting Countries (OPEC+)
cartel meets in June 2024, supply cuts are expected to be
carried over into the second half of the next year. Oil prices
in the context of supply cuts and weakening demand will be a
monitorable for markets.
Heat/ Monsoon:
The Indian Meteorological Department (IMD) forecasts an above
normal monsoon (> 106% of long period average (LPA) rainfall).
Climate model forecasts indicate neutral condition by the
beginning of monsoon season and La Niña conditions during
second half of monsoon season. The model forecasts also
indicate positive Indian Ocean Dipole (IOD) conditions likely
to develop during the monsoon season. With regards to the
spatial distribution, forecasts indicate above normal rainfall
is likely over most part of the country except some areas of
north-west, East, and north-east India, where below normal
rainfall is likely.
Monthly Performance for Key Indices:

Source: Bloomberg
.*Calendar year returns.
Note: Market scenarios are not reliable indicators for current or future performance. The same should not be construed as investment advice or as any research report/research recommendation.
Past performance may or may not be sustained in future.
Note: Market scenarios are not reliable indicators for current or future performance. The same should not be construed as investment advice or as any research report/research recommendation.
Past performance may or may not be sustained in future.
Market View
India's growth story may continue to unfold positively,
supported by a confluence of factors. FY24 was a good year for
all categories in the market, with mid and small cap doing
very well.
Despite global headwinds like geopolitical tensions and
commodity price volatility, the domestic economy has displayed
resilience. Several tailwind indicators such as power demand,
recovering rural demand, buoyant capital markets, improving
corporate capex and external demand, rising industrial output
led to a healthy investment climate and may provide a fillip
to the economy leading to growth momentum.
A notable trend in India's growth story is the improvement in
capacity utilization, largely driven by cyclical and
capital-intensive sectors which in turn suggests that
corporates are investing to keep pace with rising demand in
the economy.
While the larger construct looks positive in India, valuations
continue to remain elevated at a broad level with some
exceptions like Large Banks, select utilities, commodities
etc. With elevated valuations and rising bond yields, the
equity risk premium tends to reduce.
Given the election cycle across different countries, we can
anticipate some policy shifts which in turn may lead to higher
volatility/uncertainty in 2nd half of the year making a case
of asset allocation strategies which can aid better risk
management.
Asset allocation in line with investment goals and risk
appetite is important for better risk – return optimization.
Herein asset allocation funds investing across two or more
asset classes can help in lowering volatility and may provide
better balance to the overall portfolio mix.
From a pure equity perspective Large Cap oriented strategies
like Large/Flexi/Multi Cap appear better placed in the current
context while on the thematic space Banking & Financial
services space appears interesting on relative valuations.
Chart of the month :
Solid end to FY24 as Goods and Services Tax (GST) collections rose to record high level. GST collections in April 2024 (pertaining to business activity in March 2024) grew +13% YoY, broadly the same growth as in the last few months (growth had averaged 13% between the October 2023 – March 2024 period). Collections rose to record levels at INR 2.1 Tn in April 2024, highest since the tax regime started in 2017. Growth in GST collections is being driven largely by domestic activity led collections and not due to Indian Export Import (EXIM) Bank trade.

Source:
MOSPI, NIMF Research, CEIC
Disclaimer: The information herein above is
meant only for general reading purposes and the views being
expressed only constitute opinions and therefore cannot be
considered as guidelines, recommendations or as a professional
guide for the readers. The document has been prepared on the
basis of publicly available information, internally developed
data and other sources believed to be reliable. The sponsors,
the Investment Manager, the Trustee or any of their directors,
employees, Associates or representatives (‘entities & their
Associate”) do not assume any responsibility for, or warrant
the accuracy, completeness, adequacy and reliability of such
information. Recipients of this information are advised to
rely on their own analysis, interpretations & investigations.
Readers are also advised to seek independent professional
advice in order to arrive at an informed investment decision.
Entities & their associates including persons involved in the
preparation or issuance of this material, shall not be liable
in any way for any direct, indirect, special, incidental,
consequential, punitive, or exemplary damages, including on
account of lost profits arising from the information contained
in this material. Recipient alone shall be fully responsible
for any decision taken on the basis of this document.
*The sectors mentioned are not a recommendation to buy/sell
in the said sectors. Details mentioned above are for
information purpose only.
