
Macro and
Equity Market
Outlook
Equity Market
Outlook
GLOBAL MACRO & MARKETS
India’s NSE NIFTY 50 index ended the month of April 2026 in green (+7.5%).
Among major global indices, the Japanese NIKKEI (+16.1%), Morgan
Stanley Capital International (MSCI) World (+9.4%), the Euro 50 (+5.6%)
and the S&P 500 (+10.4%) ended the month of April 2026 with positive
returns. Performance was positive among Emerging Market (EM) indices as
well, with the MSCI EM, Hang Seng, BOVESPA Brazil recording sequential
returns of (+14.5%), (+4.0%), and (-0.1%) respectively.
The London Metals Exchange (LME) Metals Index rose (+4.5%) in April
2026. West Texas Intermediate (WTI) rose MoM, by (3.6%) and Brent Crude
fell MoM, by (-3.7%), respectively, as markets remained cautious given
geopolitical uncertainty.
The Dollar Index fell (-1.9%), through April 2026, with the US Dollar (USD)
appreciating vis-à-vis Emerging Market (EM) currencies (2.4%) and
appreciating against the Indian Rupee (INR) on the spot market (+0.1%).
India 10Y G-Sec yields fell by 2.00 bps, while US 10Y G-Sec yields rose by
5.40 bps, and the German Bund yield rose by 3.30 bps, with rates settling
at 7.02%, 4.37% and 3.04%, respectively.
Domestic Macro & Markets
The BSE SENSEX rose (+6.9%) in April 2026, in line with the NSE NIFTY
Index. The BSE Mid-cap index & the BSE Small-Cap index outperformed the
BSE SENSEX, rising by (12.7%) & (19.6%), over the month of April 2026,
respectively. Sector-wise, Power, Realty and Capital goods were the top
outperformers over the month of April 2026, clocking (+22.2%), (+21.4%)
and (20.2%) respectively. All of BSE Sensex’s 13 major sectoral indices
ended the month of April 2026 in green.

Net Foreign Institutional Investors (FII) flows into equities were Negative
for April 2026 at (-$6.47 Bn), following (-12.72 Bn) in March 2026. Domestic
Institutional Investors (DIIs) remained net buyers of Indian equities for the
32nd consecutive month with flows of +$5.09 Bn in April 2026 compared
to (+15.41 Bn) In March 2026.
India's high frequency data update:
Record levels of Goods and Services (GST) collections, stable retail inflation,
deflated input inflation, rising core sector outputs, and elevated credit
growth augurs well for the Indian economy.
Purchasing Managers’ Index Manufacturing PMI:
India’s Purchasing Managers’ Index Manufacturing (PMI) in April 2026
rebounded to 54.7 from 53.9 in March 2026, showing a clear improvement in
operating conditions after hitting a four year low the previous month. The
recovery was driven by stronger demand, faster output growth, and rising
export orders, though cost pressure remained elevated.
Goods and Services Tax (GST) Collection:
Gross collections of INR 2.42 Tn (+8.7% YoY) in April 2026 concluded the
forty-eight consecutive months of collections over the INR 1.4 Tn mark.
The Gross Domestic Revenue stood at Rs 1.85 lakh crore, up 4.3%, while
Gross Import Revenue stood at Rs 0.57 lakh crore, marking a sharp rise of
25.8% during the month.
Core Sector Production:
The index of eight core sector industries de-grew (-0.4% YoY) in March
2026, against a (+2.3% YoY) growth in February 2026. Four out of eight
constituent segments grew YoY, driven by Natura Gas (+6.4% YoY),
Petroleum Refinery Products (+0.1% YoY), Steel (+2.2% YoY), & Cement
(+4.0% YoY).
Industrial Production:
Factory output growth as measured by the Index of Industrial Production
(IIP) grew YoY by (+4.1%) in March 2026, vs a growth of (+5.2%) YoY in
February 2026. Driven by positive growths in all the 3 major sectors- Mining
(+5.5% YoY), Manufacturing (+4.3% YoY) and Electricity (0.8% YoY).
Credit growth:
Scheduled Commercial Bank Credit growth in April 2026 rose to (+15.9%)
YoY vs (+14.6%) YoY in March 2026. Agriculture and allied activities credit
in April 2026 grew by (+16%) YoY, while industrial sector credit grew by
(+15%) YoY, the services sector credit grew by (+19%) YoY.
Inflation:
Mar’26 Consumer Price Index (CPI) inflation rate accelerated YoY to 3.40%,
up from 3.21% in Feb’26. Food inflation accelerated YoY to 3.87%, up from
(+3.47%) in the previous month of Feb’26. The Wholesale Price Index (WPI)
inflation rose sequentially in Mar’26, with the print at (+3.88%) YoY,
primarily due to increase in prices of crude petroleum & natural gas, other
manufacturing, non-food articles, manufacture of basic metals and food
articles etc.
Trade Deficit:
Indian Merchandise Exports rose by (+6.3%) YoY to $38.92 Bn in March
2026. Imports fell by (-6.46%) YoY to $59.59 Bn. Merchandise trade deficit
fell to (-$20.67) Bn, down from (-$27.1) Bn in February 2026 and (-$21.69)
Bn a year earlier.
Events to watch out for in May 2026
Trade Related News flow:
India finalized a landmark Free Trade
Agreement (FTA) with New Zealand on April 27, 2026, granting duty free
access for Indian exports and reducing tariffs on 95% of imports from New
Zealand, while excluding sensitive items such as dairy, sugar, gems,
jewellery, and metals. The deal also includes a $20Bn investment
commitment over 15 years and provisions for student mobility and post
study work visas. In parallel, negotiations with South Korea began in April
to upgrade the existing economic partnership pact, while bilateral
agreements with Canada and the Gulf Cooperation Council (GCC) remain
under close watch.
Federal Open Market Committee (FOMC Meet):
The FOMC meeting
held on April 28-29, 2026, resulted in the Federal Reserve keeping interest
rates unchanged at 3.5% to 3.75%. Inflation remains elevated, while job
gains continue to be weak. The Fed reiterated its commitment to
maintaining liquidity through Treasury purchases, while signalling that rate
cuts could be considered later in 2026 depending on inflation trends. The
next FOMC meeting is scheduled to be held on June 16-17, 2026.
The Reserve Bank of India Monetary Policy Committee (RBI MPC)
Meet:
The RBI’s MPC convened from April 6-8, 2026, and unanimously
voted to keep the policy repo rate unchanged at 5.25%. The decision was
guided by rising inflation risks from elevated crude oil prices, rupee
depreciation, and supply chain disruptions linked to the Middle East
conflict. The RBI revised FY27 GDP growth to 6.9% and inflation to 4.6%,
highlighting concerns around global volatility and domestic cost pressures.
The next MPC meeting is scheduled for June 3-5, 2026.
Other things to watch out for:
UAE’s abrupt exit from the Organization
of the Petroleum Exporting Countries (OPEC) is adding to the already
volatile Oil market since the West-Asia conflict began in Mar’26. OPEC+
also announced an increase in oil production by 206,000 barrels per day
starting April, aimed at stabilizing markets after disruptions in the Strait of
Hormuz. Geopolitical tensions remain elevated, with the US–Israel-Iran
conflict continuing to disrupt Gulf shipping, alongside persistent
uncertainties in Gaza and the ongoing Russia-Ukraine war. These
developments may expect to weigh on global trade flows and commodity
markets through the quarter.
Monthly Performance for Key Indices:
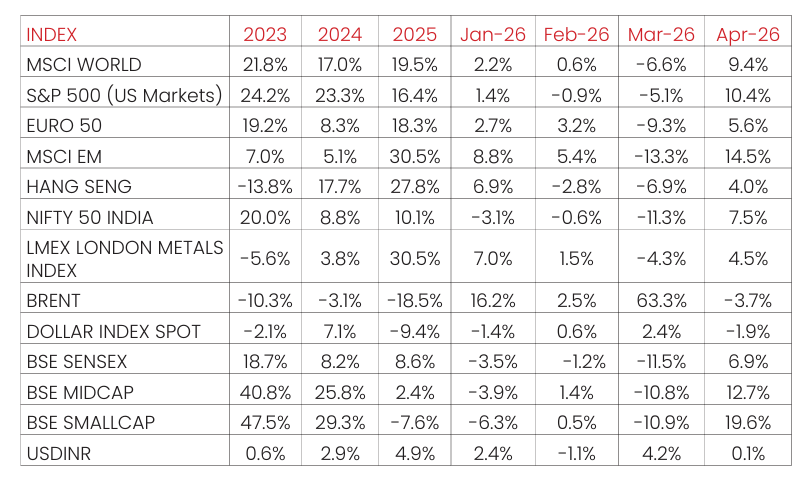
Source:NIMF Research, Bloomberg, RBI
Note: Market scenarios are not reliable indicators for current or future performance. The same should not be construed as investment advice or as any research report/research recommendation.
Past performance may or may not be sustained in future.
Note: Market scenarios are not reliable indicators for current or future performance. The same should not be construed as investment advice or as any research report/research recommendation.
Past performance may or may not be sustained in future.
Market View
Domestic equity markets have remained volatile amid persistent
geopolitical uncertainties and evolving global macro dynamics. While
earlier concerns around US–Iran tensions and crude oil spikes have
somewhat eased, risks to energy prices still linger given the fragile
situation in the Middle East. Crude oil prices have moderated from recent
highs but remain sensitive to any escalation keeping investor sentiment
cautious.
The Indian Rupee has shown phases of volatility against the U.S. Dollar,
influenced by global capital flows and dollar strength, but has remained
relatively range-bound compared to earlier sharp depreciation pressures.
Markets continue to trade below Sep 2024 highs and valuations appear
reasonable post the sell off across many sectors.
The duration of the current crisis is important determinant of how the
market behaves. The current elevated energy costs are critical for both
domestic and global growth and longer the crises continue, corporate
earnings may witness a sharp impact
Given geopolitical challenges and its implications, long term investments
may be invested systematically using the current corrective phase of the
market. Lack of visibility on impact of earnings due to crude oil, supply
chain challenges, currency depreciation are near term factors which may
delay recovery. Hence a systematic approach to adding allocations might
help in potentially lowering the anticipated volatility. The impact of war is
visible on select segments; delayed resolution could lead to downgrade in
earnings.
Given geopolitical challenges and its implications, long term investments
may be invested systematically using the current corrective phase of the
market. Lack of visibility on impact of earnings due to Crude Oil, Supply
challenges, Currency depreciation are near term factors which can delay
recovery. Hence a systematic approach to adding allocations might help in
potentially lowering the anticipated volatility.
Asset allocation in line with the risk appetite of the investor is an
important tool to navigate any unanticipated volatility. Accordingly Large
Cap & Large Cap oriented diversified strategies along with hybrid funds
might appear to be better placed on risk-reward basis, while Mid/Small cap
allocation may be considered in a staggered manner through systematic
investment with a long-term view.
Source:
NIMF Research,Bloomberg
Disclaimer:
The current fund philosophy may change in future depending on market conditions or fund manager’s views. The sectors mentioned
are not a recommendation to buy/sell in the said sectors. The scheme may or may not have future position in the said sectors. The
information herein above is meant only for general reading purposes and the views being expressed only constitute opinions and
therefore cannot be considered as guidelines, recommendations or as a professional guide for the readers. The document has been
prepared on the basis of publicly available information, internally developed data and other sources believed to be reliable. The
sponsors, the Investment Manager, the Trustee or any of their directors, employees, Associates or representatives (‘entities & their
Associate”) do not assume any responsibility for, or warrant the accuracy, completeness, adequacy and reliability of such information.
Recipients of this information are advised to rely on their own analysis, interpretations & investigations. Readers are also advised to
seek independent professional advice in order to arrive at an informed investment decision. Entities & the associates including
persons involved in the preparation or issuance of this material, shall not be liable in any way for any direct, indirect, special, incidental,
consequential, punitive, or exemplary damages, including on account of lost profits arising from the information contained in this
material. Recipient alone shall be fully responsible for any decision taken on the basis of this document.