
Macro and
Equity Market
Outlook
Equity Market
Outlook
GLOBAL MACRO & MARKETS
India’s NSE NIFTY index fell by (-6.2%) in October 2024, after five
consecutive months of growth. Among major global indices, the
S&P500 (-1.0%), the Euro 50 (+3.5%), and the Morgan Stanley Capital
International (MSCI) World (-2.0%) ended the month, October 2024
with negative returns, while the Japanese NIKKEI (+3.1%) bucked the
trend on a sequential basis, ending the October 2024 month in
green. Performance was largely negative among Emerging Market
(EM) indices, with the Morgan Stanley Capital International
Emerging Markets (MSCI EM), the Hang Seng (Hong Kong), the
BOVESPA Brazil (BVSP) recording sequential returns of (-4.4%),
(-3.9%), and (-3.5%), respectively.
The London Metals Exchange (LME) Metals Index fell by (-3.2%) in
October 2024, driven by weak global demand and limited supplies.
Despite the tensions in the Middle East, The West Texas
Intermediate (WTI) and Brent Crude moved up marginally MoM, by
(+1.6%) and (+1.9%), respectively, as the demand remained
cautious for the oil prices.
The Dollar index appreciated by (+3.2%) through October 2024, with
the US Dollar (USD) losing vis-à-vis Emerging Market (EM)
currencies (-3.1%) and appreciating marginally against the Indian
Rupee (INR) on the spot market (+0.3%). India 10Y G-Sec yields rose
by (+10 bps), while US 10Y G-Sec yields rose by (+50 bps), and the
German Bund yield rose by (+27 bps), with rates settling at 6.84%,
4.28% and 2.39% respectively, as the results of the United States
(US) Federal elections looms in November 2024.
Domestic Macro & Markets
The BSE SENSEX (-5.8%) fell in October 2024, in line with the NSE NIFTY
index. The BSE Mid-cap index underperformed the BSE Sensex,
recording falls of (-6.9%), while the BSE Small-Cap index
outperformed, falling by 3.8% over the month. Sector-wise,
Healthcare, Information Technology (IT) and Teck indices were the
top 3 performers over the month, clocking (-0.7%), (-2.3%), and
(-4.6%), respectively. 13 of BSE’s 13 major sectoral indices ended the
month, October 2024 in red.
Net Foreign Institutional Investors (FII) flows into equities were
negative for October 2024 (-$ 11.2 Bn, following $ 6.9 Bn in
September 2024). The Domestic Institutional Investors (DIIs)
remained net buyers of Indian equities (+$12.76 Bn, from +$3.8 Bn
last month, September 2024). In Calendar Year (CY2024), Net
Foreign Institutional Flows (FII) Flows stood at (+$0.6 Bn, while net
Domestic Institutional Investors (DII) investments in the cash
markets stood at (+$53.6 Bn), outpacing the Foreign Institutional
Investors’ (FII) investments.

India's high frequency data update:
Record levels of Goods and Services Tax (GST) collections, stable retail
inflation, deflated input inflation, rising core sector outputs, and
elevated credit growth augurs well for the Indian economy.
Purchasing Managers’ Index Manufacturing PMI:
India’s Manufacturing Purchasing Managers’ Index (PMI) in October
2024 rose month on month to 57.4 (vs 56.5 in September 2024),
remaining in expansion zone (>50) for the 39th straight month. The
slowdown was driven by an acceleration in exports and sales, but with
rising input prices.
Goods and Services Tax (GST) Collection:
Second Highest gross collections of INR 1.87 Tn (+9% YoY) in October
2024 concluded the thirty second consecutive month of
collections over the INR 1.4 Tn mark, following previous record
collections of INR 2.1 Tn in April 2024. Rising compliance, higher
output prices, festive season demand, rising collections from
imports and domestic transaction volume uptick has driven
elevated tax collections.
Core Sector Production:
The index of eight core sector industries grew by (+2%) YoY in
September 2024, against a 9.5% growth in September 2023, as an
unfavourable base effect came into play. 5 out of eight constituent
segments grew YoY, driven by refinery production (+5.8% YoY).
Industrial Production:
Factory output growth as measured by Drepo – the Index of
Industrial Production (IIP) decelerated MoM to (-0.1%) in August
2024, vs a growth of (+4.7%) YoY in July 2024, driven by positive, and
YoY de-growths in 2 of 3 major sectors- Mining and Electricity.
Credit growth:
Scheduled Commercial Bank Credit growth reached (+11.52%) YoY
as of 18th October 2024 against a YoY growth of (+19.98% as
observed on 20th October 2023, as a strong base effect came to
play post the merger of Housing Development Finance
Corporation (HDFC and HDFC Bank). Bank deposit growth
outpaced credit growth after many quarters as loan to deposit
ratio normalised.
Inflation:
September 2024 Consumer Price Index (CPI) inflation rate
accelerated MoM to (+5.49%), up from (+3.65%) in July 2024. Food
inflation came in at a faster pace, at (+9.24%). The Wholesale Price
Index (WPI) inflation accelerated sequentially in September 2024,
with the print at (+1.84%), (+53 bps) up from August 2024.
Trade Deficit:
Indian Merchandise Exports rose by (+0.49%) YoY to $34.58 Bn in
September 2024, while Imports rose by (+1.6%) YoY to $55.36 Bn.
Merchandise trade deficit widened by (-3.49%) YoY to $20.8 Bn.
Events to watch out for in November 2024:
Oil Prices:
Geopolitical tensions, China’s recovery following fiscal stimulus
announcements, production cut reversals from The Organization
of the Petroleum Exporting Countries (OPEC+) members from
December 2023 onwards, have led to volatile oil prices. Oil market
developments remain a key monitorable for global and Indian
markets alike.
Other things to watch out for:
The United States (US) Election related development, Festive
season demand, The Reserve Bank of India (RBI’s) policy stance,
Indian Earnings Season all remain key events for markets to watch
out for.
Monthly Performance for Key Indices:
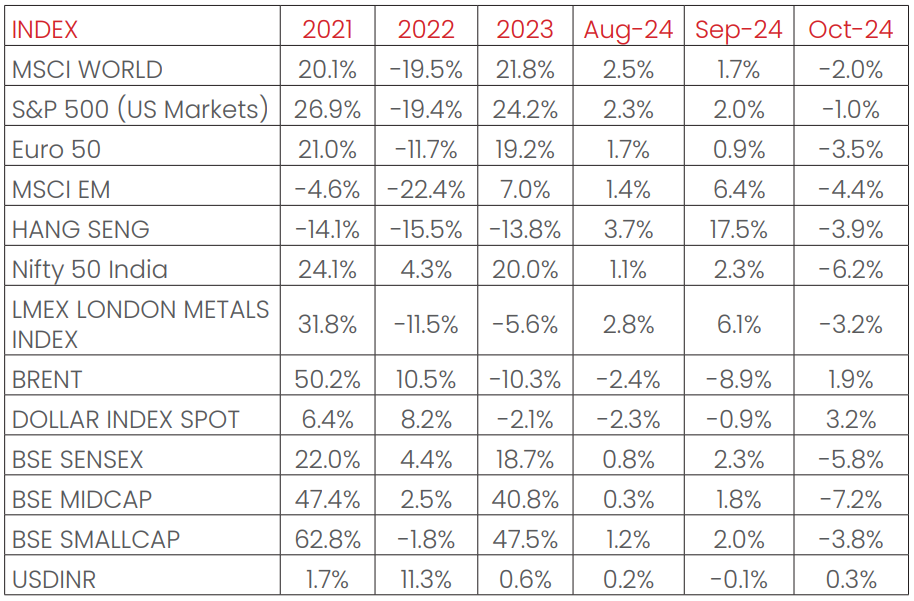
Source: Bloomberg
.*Calendar year returns.
Note:Market scenarios are not reliable indicators for current or future performance. The same should not be construed as investment advice or as any research report/research recommendation.
Past performance may or may not be sustained in future.
Note:Market scenarios are not reliable indicators for current or future performance. The same should not be construed as investment advice or as any research report/research recommendation.
Past performance may or may not be sustained in future.
Market View
October 2024 was a negative month for the Indian stock market,
driven by relatively negative flows from foreign institutional
investors (FIIs) post the China stimulus, global back drop of
geopolitical uncertainty and weaker earnings in the near term
along with the first season of Q2 results which has been below
market expectations.
All the sectoral indices ended the month October 2024 in red,
sectors with weaker results have seen major sell off by Foreign
Portfolio Investors (FPIs).
Most of the quick indicators are seeing a slowdown, there is some
slowdown in discretionary spending and the core inflation has
gone up, vehicle sales has gone down tremendously.
Equity valuations continued to remain elevated compared to
historical averages with Mid-Caps trading at significant premium
followed by small and large caps. Current valuations estimate the
current growth to continue and with low room to absorb any
disappointments and in large pockets of the market.
Recovery in International demand conditions and local rural
recovery can provide some upside and going forward its
estimated that market performance may be largely dependent
on earnings growth.
Considering the recent geopolitical events, current market
valuations we anticipate higher volatility and accordingly
investors can consider large cap-oriented strategies like
Large/Flexi/Multi Cap appear over the medium term.
Investors seeking better downside protection may consider asset
allocation products like Multi Asset Allocation, Dynamic Equity ,etc.
Long term investors with appropriate risk appetite can consider
Mid and Small Cap allocations in staggered manner through the
systematic route.
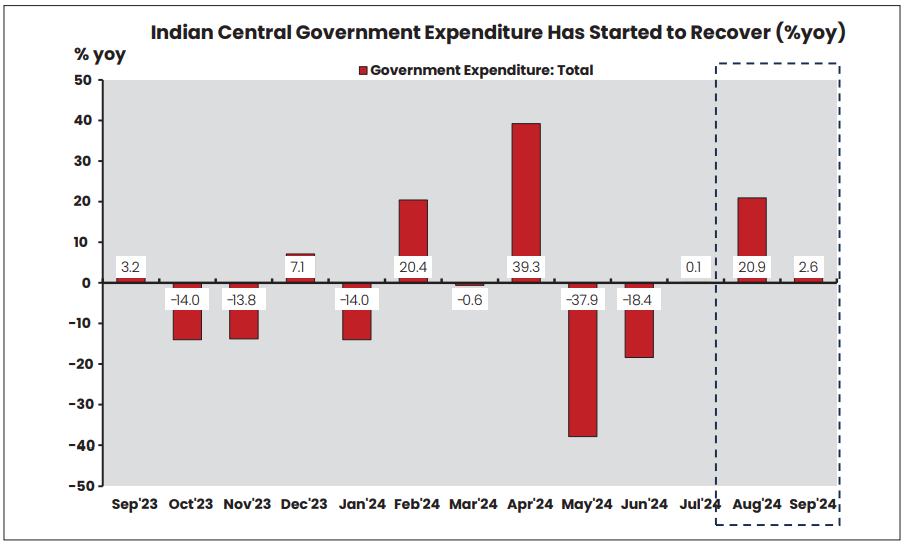
Chart of the Month:
Overall Central Government expenditure increased by (+2.6%) YoY,
mainly driven by rural spending. In 1H of FY25, the Government has
spent around INR 4.1tn (-15.4% FYTD YoY) with the run-rate at 37.4%
of Budget Estimates (BE), the lowest in a decade. However, green
shoots of Government Capex seen in September 2024 data.
Source:
NIMF Research, RBI (Monthly Data), CEIC
Disclaimer:
The views expressed herein are based on publicly available information and
other sources believed to be
reliable. It is issued for information purposes only and is not an offer to sell or a solicitation to
buy/sell any mutual fund
units/securities. It should be noted that the analysis, opinions, views expressed in the document are
based on the Budget
proposals presented by the Honorable Finance Minister in the Parliament on July 22, 2024 and the said
Budget proposals
may change or may be different at the time the Budget is passed by the Parliament and notified by the
Government. The
information contained in this document is for general purposes only and not a complete disclosure of
every material fact
of Indian Budget. For a detailed study, please refer to the budget documents available on
http://www.indiabudget.gov.in
The information herein above is meant only for general reading purposes and the views being expressed
only constitute
opinions and therefore cannot be considered as guidelines, recommendations or as a professional guide
for the readers.
The document has been prepared on the basis of publicly available information, internally developed
data and other
sources believed to be reliable. The sponsors, the Investment Manager, the Trustee or any of their
directors, employees,
Associates or representatives (‘entities & their Associate”) do not assume any responsibility for, or
warrant the accuracy,
completeness, adequacy and reliability of such information. Recipients of this information are advised
to rely on their own
analysis, interpretations & investigations. Readers are also advised to seek independent professional
advice in order to
arrive at an informed investment decision. Entities & their associates including persons involved in
the preparation or
issuance of this material, shall not be liable in any way for any direct, indirect, special,
incidental, consequential, punitive,
or exemplary damages, including on account of lost profits arising from the information contained in
this material.
Recipient alone shall be fully responsible for any decision taken on the basis of this document.
The sectors mentioned are not a recommendation to buy/sell in the said sectors. Details mentioned
above are for
information purpose only.