
Macro and
Equity Market
Outlook
Equity Market
Outlook
Global Macro & Markets
Owing to concerns around the US taper and ripple
effect of the Evergrande crisis in China, global equities
took a pause on its winning streak and declined 4.3% in
September, sharpest monthly decline since March-2020.
NIKKEI (+4.9%) outperformed S&P500 (-4.8%) and
Euro-50 (-3.5%). Fall in Emerging Markets (-4.2%) was
led by Hang Seng (-5%) and BOVESPA Brazil (-6.6%),
while NIFTY India (+2.8%) and MOEX Russia (+4.1%)
outperformed the index. Crude oil prices rallied
7.6%m/m owing to a decline in US crude inventory,
lower supply concerns and higher global demand
outlook by the IEA (International Energy Agency) and
OPEC (Organization of the Petroleum Exporting
Countries). LME Metals index ended the month 3.1%
lower in contrast to crude oil prices.
Domestic Macro & Markets
India was among the best performing markets globally, taking its
year-to-date relative outperformance to 30 ppt compared to MSCI EM
Index. BSE MidCap index (+5.9%) and BSE SmallCap index (+4.3%) resumed
outperformance against SENSEX (+2.7%) after the first monthly
underperformance of the year in August. Among sector indices, Energy
(+12%), Discretionary (+6%) and Communication Services (+6%) gained the
most while Materials (-2%), HealthCare (-1%) and Financials (0%) lost the
most. Market breadth rose in September as 89% of BSE 100 stocks
remained above their respective 200-day moving averages. FPIs bought
US$1227 Mn of Indian equities while DIIs bought US$789 Mn.

India's high frequency data update:
With current account in surplus, GST collections improving, manufacturing
activity expanding and inflation moderating, macro data has been quite
encouraging in recent period.
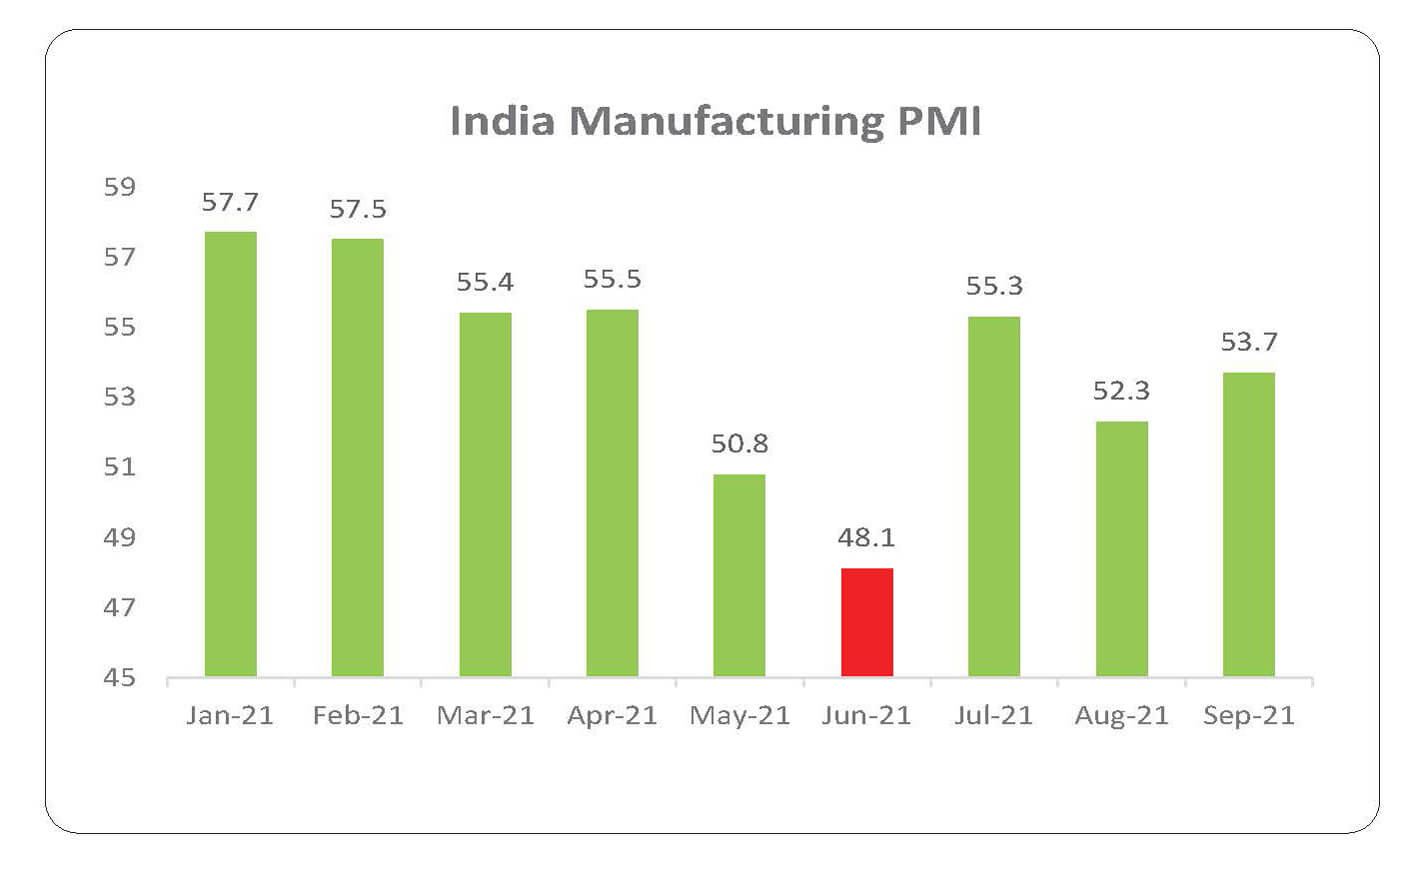
Manufacturing PMI:
Manufacturing PMI rose to 53.7 in September compared to 52.3 in August.
The factory activity rose on account of production growth boosted by
stronger new order inflows, companies scaling up input buying and
acceleration in input cost inflation.
GST Collection:
Collections in September picked up to INR 1.17 Tn (+23% YoY) as
compared to INR 1.12 Tn in August, crossing the crucial INR 1 Tn mark for
third month in a row, indicating a fast recovery.
Power consumption:
Power consumption in the month of September was 0.8% higher than
September-20 and 5.5% higher than the consumption in August 2019.
Core sector production:
Core sector production rose 9.3% in August as against a YoY rise of
16.4%
in July and fall of 6.9% in August last year.
Industrial Production:
Manufacturing IIP rose by 10.5% YoY in July vs a fall of 11.4% in July
of last
year.
Credit growth:
Credit growth remained sluggish at 6.7% YoY as of 10-Septmber against
YoY growth of 5.3% as observed on 11-September 2020. Aggregate
deposit growth fell to 9.3% YoY.
Inflation:
CPI inflation in August moderated to 5.3% from 5.6% as observed in July
led by lower-than-expected food inflation. WPI inflation came at 11.4% in
July increasing from 11.2% in June led by fuel and power inflation at 26.1%
and inflation for basic metals at 27.5%.
Trade Deficit:
August trade deficit further widened to US$13.9 bn as compared to US$11
bn in July. Non-oil exports increased 36.6% to US$28.6 bn over August
2020 while non-oil imports increased 43.9% YoY to US$35.4 bn.
Current Account Balance:
The current account registered a surplus in 1QFY22, rising to $6.5 bn
(0.9%
of GDP) against a deficit of US$8.2 bn in 4QFY21 (-1% of GDP). The surplus
was led by moderation in trade deficit to US$30.7 bn and an increase in net
services receipts to US$25.8 bn.
Normal Monsoon
Though delayed and erratic, 32% excess rain in September helped offset
the 24% and 6.8% deficiency in August and July rainfall respectively. With
rainfall amounting to 99% of the long period average, it has been a good
monsoon, making it third consecutive normal monsoon in India.
The DISCOM reform scheme
All Indian states have come on-board for the INR 3 Trillion DISCOMs
reforms
scheme. The new 'Reforms-based and Results-linked, Revamped Distribution
Sector Scheme' seeks to improve the operational efficiencies and financial
sustainability of all discoms/power departments (excluding private sector
discoms) by providing conditional financial assistance to discoms for
strengthening of supply infrastructure.
Market View
Indian equity market sentiment has remained resilient despite the
record
high valuations supported by higher liquidity, strong earnings possibility,
relatively lower rates. In our view profit to GDP ratio in India may continue
to rise in a foreseeable future as lot of segments which hitherto had not
contributed meaningfully are witnessing a turnaround. The improving
domestic macro data suggests that a reasonable economic recovery is
underway. Capex revival, business normalization, improving global trade
and domestic consumption are key contributors to this anticipated
recovery.
Higher inflation may pose a potential challenge for prevailing easy
liquidity
& lower rates and any faster than expected normalization in the same may
impact market sentiment. Geo-political developments and oil prices are
other key areas to be tracked.
We believe all three market cap segments (Large, Mid and Small) offer
similar risk reward, making a case for diversified strategies with investments
across market caps. Conservative investors seeking equity exposure with
lower volatility may consider asset allocation strategies like Multi
Asset/Balanced Advantage etc.
Note: The sectors mentioned are not a recommendation to buy/sell in the
said sectors.
The schemes may or may not have future position in the said
sectors. For complete details on Holdings & Sectors of NIMF schemes, please visit
website mf.nipponindiaim.com;
Past performance may or may not be sustained in future
Past performance may or may not be sustained in future
Chart of the month :
In contrast to some near-term growth challenges in the rest of the
World,
Indian manufacturing has been resilient on the back of improvement in
domestic demand.
Common Source:
IHS Markit, Nippon India Mutual Fund Research,
Bloomberg
Disclaimer: The information herein above is meant only for general
reading purposes and the views being expressed only constitute
opinions and therefore cannot be considered as guidelines, recommendations or as a
professional guide for the readers. The document
has been prepared on the basis of publicly available information, internally developed
data and other sources believed to be reliable. The
sponsor, the Investment Manager, the Trustee or any of their directors, employees,
associates or representatives (“entities & their
associates”) do not assume any responsibility for, or warrant the accuracy,
completeness, adequacy and reliability of such information.
Recipients of this information are advised to rely on their own analysis,
interpretations & investigations. Readers are also advised to seek
independent professional advice in order to arrive at an informed investment decision.
Entities & their associates including persons
involved in the preparation or issuance of this material shall not be liable in any way
for any direct, indirect, special, incidental,
consequential, punitive or exemplary damages, including on account of lost profits
arising from the information contained in this
material. Recipient alone shall be fully responsible for any decision taken on the basis
of this document.