
Macro and
Equity Market
Outlook
Equity Market
Outlook
GLOBAL MACRO &
MARKETS – August 2023
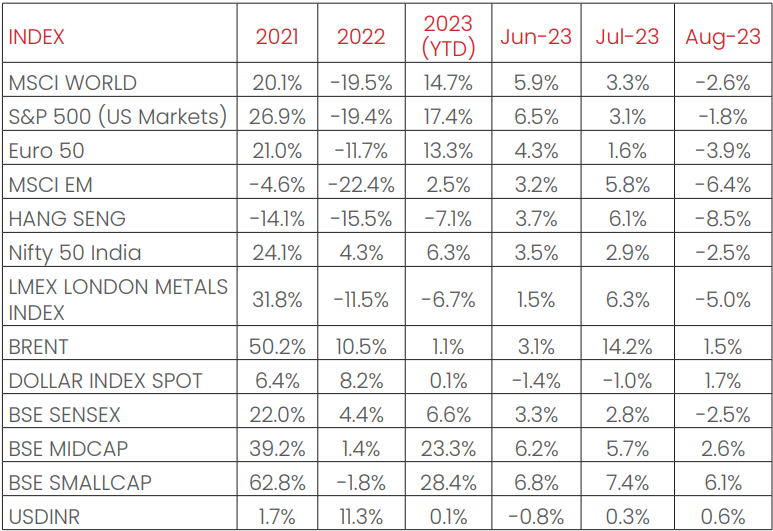
India’s NIFTY index fell 2.5% in August. The S&P500 (-1.8%), the Euro 50
(-3.9%), the MSCI World (-2.6%), Japan’s Nikkei (-1.7%) also ended
negative, as global markets faced a negative month. Among
emerging markets indices, the MSCI EM, the HANG SENG, BOVESPA
Brazil all recorded degrowths in August, of -6.4%, -8.5%, and -5.5%
respectively. MOEX Russia bucked the trend, recording a growth of
+5.0% over the month.
LME Metals Index fell by 5.0% in August as China’s Manufacturing
PMI remained in contraction (<50%) and US Dollar strengthened. Despite Chinese Government fiscal
stimulus measures base and industrial metal prices remained volatile. China also announced moves to
support its currency, which slid toward its weakest level since 2007 in August.
WTI and Brent Crude rose in August, by +2.2% and +1.5%
respectively, as the market’s supply remained tight post supply
restrictions by OPEC+ (Organization of the Petroleum Exporting
Countries plus) in previous months, and demand concerns were
reduced by China’s fiscal and monetary measures to bolster its
economy. WTI crude reached its highest level since November
2022, settling at USD 86. The Dollar index strengthened by +1.7% over
the month, with the Dollar appreciating by -1.9% vis-à-vis EM
currencies and appreciating by +0.6% against the Indian Rupee.
India 10Y G-Sec remained flat, falling by -1 bps, while US 10Y G-Sec
yields rose by 15 bps, and the German Bund fell by -3 bps, with rates
settling at 7.16%, 4.11% and 2.47% respectively.
Domestic Macro & Markets - August 2023
The BSE SENSEX (-2.5%) fell in August. BSE Mid-cap and small-cap
indices outperformed the SENSEX and were up +2.6% and +6.1%,
respectively. Sector-wise, Oil & Gas, FMCG and PSU indices saw the
greatest declines, falling 5%, 4% and 2.7% respectively m/m. Top
gaining indices were Consumer Durables and IT, which were up
4.2% and 4.1% respectively.
Net FII flows, continued to be positive for August, albeit at a lower
quantum (+$1.2 Bn, following +$4.2 Bn in July). DIIs turned into
marginal net buyers of Indian equities.

India's high frequency data update:
Elevated levels of GST collections, tolerable retail core inflation, input
price deflation, rising core sectors output, and strong credit growth
augurs well for the Indian economy.
Manufacturing PMI (Purchasing Manager's Index):
Manufacturing PMI in July 2023 came in at 58.6, up to a 3-month high,
and remained in expansion zone (>50) for the 26th straight month,
sustained by new orders growth at its highest since January 2021.
Output gained for the 26th straight month, and export sales growth
accelerated to a 9-month high. Input costs rose to a 12-month high,
whereas employment hit a 4-month low, remaining well above the
trend.
GST Collection:
Collections of INR 1.59 Tn (+10.8% YoY) in August 2023 concluded the
18th consecutive month of collections over the INR 1.4 Tn mark,
following record collections of INR 1.87 Tn in April 2023. The YoY rise
in collections was owed to rises in domestic transactions
(Including import of services) (+14% growth YoY). Rising
compliance, boosted economic activity and improved consumer
spending are key components of sustained GST collections.
Core sector production:
Core sector production growth cooled down marginally to 8%yoy
in July 2023, against an 8.2% Jump in June 2023, owing to an
expansion in all of the eight component sectors. Production of Coal,
Crude Oil, Fertilizers, Steel, Petroleum refinery products, electricity,
natural gas, and Cement rose by 14.9%, 2.1%, 3.3%, 13.5%, 3.6%, 6.9%,
8.9%, and 7.1% YoY, respectively.
Industrial Production:
Factory output as measured by the IIP index (Index of Industrial
Production) eased MoM by 3.7% YoY in June 2023 vs a growth of
5.3% YoY (upwardly revised) in May 2023. Mining output rose +7.6%
while manufacturing output grew by 3.1% YoY in June.
Credit growth:
Credit growth reached 19.72% YoY as of 11th August 2023 against
YoY growth of 14.11% as observed on 12th August 2022.
Inflation:
July’s CPI inflation rate breached RBI’s comfort zone and reached
7.44% in July 2023, from 4.81% in June 2023, at a 15-month high.
Acceleration in the CPI rate was attributed to food basket inflation,
which came in at 11.51% in July 2023, compared to the 4.55% rise in
June 2023. WPI inflation remained in negative territory, with the July
2023 print at -1.36%, 276 bps down from June 2023’s at -4.12%, as
higher prices for food and commodities played into a higher base.
This was the fourth straight month of deflation witnessed.
Trade Deficit:
Indian Merchandise Exports recorded a decline of -16% YoY to
$32.25 Bn in July 2023, while Imports growth declined by -17 % YoY to
$52.92 Bn. India’s trade deficit narrowed by 18.5% YoY to $20.7 Bn.
Exports contracted for the sixth straight month, as global demand
remained tepid. Service sector exports remained resilient, at $27.17,
rising by 12% MoM.
Month gone by:
As the Q1FY24 earnings season concluded over the month, better
than expected revenue growth and margin expansions across
sectors signalled at a broader up-cycle trend for Indian equities.
Monthly Performance for Key Indices:
Note: Market scenarios are not the reliable indicators for current or future
performance. The same should not be construed as
investment advice or as any research report/research recommendation.
Past performance may or may not be sustained in future.
Source: Bloomberg
Past performance may or may not be sustained in future.
Source: Bloomberg
Market View
Higher interest rates have weighed on the global growth prospect.
While the inflation may have peaked out globally, Central Banks
remain vigilant of the elevated inflation levels and rates are
expected to be higher for longer with policy action being data
dependent.
Domestic macro trends have been resilient despite global
uncertainty. Green shoots are visible on the industry Capex recovery
which may be supported by Production Linked Incentive (PLI),
Localization, China+1. We are also witnessing early signs of recovery
in the rural demand. India’s external sector situation is supported by
strong services exports and lower imports.
India’s tax collections to GDP, credit to GDP and most importantly
rising corporate earnings to GDP reflect transparency and
formalisation reforms undertaken in the pre-pandemic period.
Valuations remain challenging in the near term. In the given market
scenario, stock selection along with risk management become
critical. We continue to focus on domestic demand related sectors
as growth and earnings certainties may be higher in related
segments.
We believe medium to long term opportunities remain strong for
India and will be driven by investment cycle & policy reforms. We
suggest investors should have a long-term orientation for equity
investments and should consider products based on their
investment goals and risk appetite. Investors can look to invest in a
staggered manner to ride the near-term uncertainties.
Conservative investors may consider asset allocation strategies.
Note: The sectors mentioned are not a recommendation to buy/sell in the said sectors.
The schemes may or may not have future
position in the said sectors. For complete details on Holdings & Sectors of NIMF schemes, please visit
website mf.nipponindiaim.com.
Past performance may or may not be sustained in future
Past performance may or may not be sustained in future
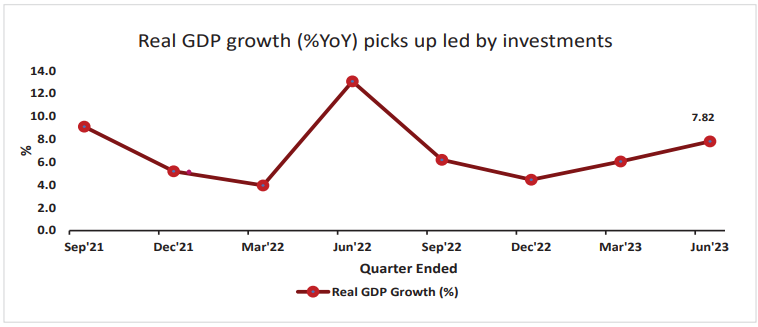
Chart of the month :
Real GDP growth of 7.8%YoY in Q1FY24 was broad-based in nature,
with investment growth (GFCF (Gross fixed capital formation))
beating private consumption growth for the fifth straight quarters.
Government consumption remained weak (-0.7%), while nominal
GDP growth touched 8%, as GDP deflator barely grew 0.2%YoY
owing to WPI deflation.
Common Source:
NIMF Research, CMIE, Bloomberg
Disclaimer: The information herein above is meant only for general reading purposes
and
the views being expressed only
constitute opinions and therefore cannot be considered as guidelines, recommendations or as a
professional guide for
the readers. The document has been prepared on the basis of publicly available information, internally
developed data
and other sources believed to be reliable. The sponsors, the Investment Manager, the Trustee or any of
their directors,
employees, Associates or representatives (‘entities & their Associate”) do not assume any
responsibility
for, or warrant the
accuracy, completeness, adequacy and reliability of such information. Recipients of this information
are
advised to rely on
their own analysis, interpretations & investigations. Readers are also advised to seek independent
professional advice in
order to arrive at an informed investment decision. Entities & their associates including persons
involved in the preparation
or issuance of this material, shall not be liable in any way for any direct, indirect, special,
incidental, consequential, punitive
or exemplary damages, including on account of lost profits arising from the information contained in
this material.
Recipient alone shall be fully responsible for any decision taken on the basis of this document.