Nippon India Multi Cap Fund
| Details as on July 31, 2021 |

|
Multi Cap Fund - An open ended equity scheme investing across large cap, mid cap, small cap stocks
It is a multi-cap, trend based fund with the flexibility to
be overweight in a particular sector or market caps
depending on the potential & opportunities as they
arise. Investment in large caps may help to capture
market movements & ensures liquidity in volatile times
while exposure to niche themes (primarily mid/small
cap companies) having scalable business models
offers alpha creation possibilities. The investment in
the emerging businesses can be further categorized as:
• Quality Mid cap plays with a track record and
scalable business models
• Emerging or niche themes with sustainable
competitive advantages
• Deep Value Component –> Deep Value Stocks -
Currently mispriced by markets due to nonfundamental
reasons
March 28, 2005
Sailesh Raj Bhan
NIFTY 500 Multicap 50:25:25 TRI
| Monthly Average : | ₹ 9,991.55 Cr |
| Month End : | ₹ 10,166.76 Cr |
| Growth Plan | ₹130.4488 |
| IDCW Plan | ₹37.4036 |
| Bonus Option | ₹130.4488 |
| Direct - Growth Plan | ₹138.8997 |
| Direct - IDCW Plan | ₹49.2084 |
| Direct - Bonus Option | ₹138.8997 |
| Entry Load: | Nil |
| Exit Load: |
10% of the units allotted shall be redeemed without any exit load, on
or before completion of 12 months from the date of allotment of units. Any redemption in excess of such limit in the first 12 months from the date of allotment shall be subject to the following exit load, Redemption of units would be done on First in First out Basis (FIFO): • 1% if redeemed or switched out on or before completion of 12 months from the date of allotment of units. • Nil, thereafter. |
| Standard Deviation | 8.04 |
| Beta | 1.04 |
| Sharpe Ratio | 0.13 |
| Note: The above measures have been calculated using monthly rolling returns for 36 months period with 3.40% risk free return (FBIL Overnight MIBOR as on 30/07/2021). | |
| Portfolio Turnover | 0.71 |
| Regular/Other than Direct | 1.92 |
| Direct | 1.32 |
| Company/Issuer | % of Assets |
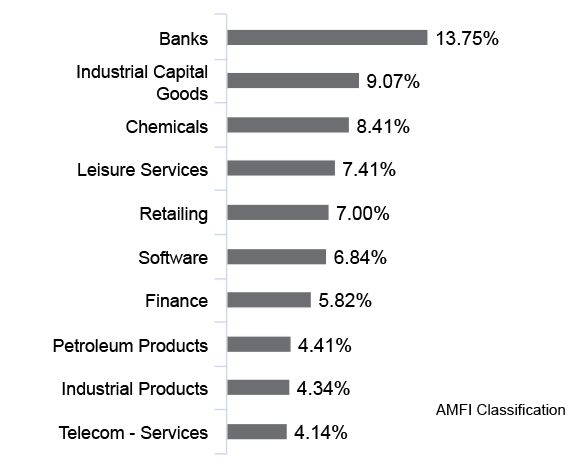
| Banks | |
| State Bank of India* | 5.10 |
| HDFC Bank Limited* | 3.06 |
| ICICI Bank Limited | 2.42 |
| Axis Bank Limited | 1.26 |
| Chemicals | |
| Linde India Limited* | 8.24 |
| Construction Project | |
| Larsen & Toubro Limited | 2.21 |
| Consumer Non Durables | |
| Tata Consumer Products Limited | 1.26 |
| ITC Limited | 1.21 |
| Hindustan Unilever Limited | 1.15 |
| Ferrous Metals | |
| Tata Steel Limited | 1.97 |
| Steel Authority of India Limited | 1.61 |
| Finance | |
| SBI Cards and Payment Services Limited | 1.58 |
| Healthcare Services | |
| Narayana Hrudayalaya Limited | 1.12 |
| Industrial Capital Goods | |
| Kennametal India Limited | 2.15 |
| Honeywell Automation India Limited | 1.85 |
| Triveni Turbine Limited | 1.11 |
| Industrial Products | |
| Vesuvius India Limited | 2.21 |
| Bharat Forge Limited | 1.21 |
| Insurance | |
| Max Financial Services Limited* | 2.43 |
| Leisure Services | |
| The Indian Hotels Company Limited* | 3.78 |
| EIH Limited* | 2.55 |
| Petroleum Products | |
| Reliance Industries Limited* | 3.40 |
| Bharat Petroleum Corporation Limited | 1.01 |
| Pharmaceuticals | |
| Divi's Laboratories Limited | 1.49 |
| Sun Pharmaceutical Industries Limited | 1.14 |
| Retailing | |
| Aditya Birla Fashion and Retail Limited* | 3.15 |
| Zomato Limited | 1.55 |
| Trent Limited | 1.27 |
| Shoppers Stop Limited | 1.03 |
| Software | |
| HCL Technologies Limited* | 2.72 |
| Infosys Limited | 2.38 |
| Telecom - Services | |
| Bharti Airtel Limited* | 4.14 |
| Transportation | |
| VRL Logistics Limited | 1.35 |
| Mahindra Logistics Limited | 1.27 |
| Equity Less Than 1% of Corpus | 23.71 |
| Cash and Other Receivables | 0.91 |
| Grand Total | 100.00 |
*Top 10 Holdings

Past performance may or may not be sustained in future. It is assumed that a SIP of ₹10,000 each executed on 10th of every month including the first installment in the Growth option of the Fund. Returns on SIP and Benchmark are annualized and cumulative investment return for cash flows resulting out of uniform and regular monthly subscriptions have been worked out on excel spreadsheet function known as XIRR. Load has not been taken into consideration.
B: Benchmark, AB: Additional Benchmark, TRI: Total Return Index
TRI - Total Returns Index reflects the returns on the index arising from (a) constituent stock price movements and (b) dividend receipts from constituent index stocks, thereby showing a true picture of returns.
For scheme performance please click here. For Fund manager wise scheme performance click here.
| Record Date | Rate (₹/ Unit) | Cum Dividend NAV | Ex-Dividend NAV |
| IDCW Plan | |||
| 22-Mar-19 | 2.43 | 30.4022 | 27.6522 |
| 23-Mar-18 | 4.75 | 32.8016 | 28.0516 |
| 17-Mar-17 | 3.00 | 31.6909 | 28.6909 |
| Direct - IDCW Plan | |||
| 22-Mar-19 | 2.43 | 38.5624 | 35.8124 |
| 23-Mar-18 | 4.75 | 40.0800 | 35.3300 |
| 17-Mar-17 | 3.00 | 37.7756 | 34.7756 |
Past performance may or may not be sustained in future. Pursuant to dividend payment, NAV falls to the extent of payout & statutory levy (if applicable). Face Value-₹ 10.
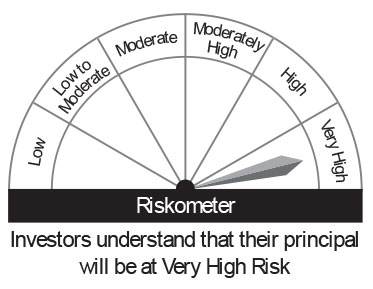
This product is suitable for investors who are seeking*:
• Long term capital growth
• Investment in equity and equity related securities

* Investors should consult their financial advisers if in doubt about whether the product is suitable for them.
Special Feature: Nippon India Any Time Money Card
Please click here for explanation on symbol: ^ and @ wherever available
