Nippon India ETF Hang Seng BeES
| Details as on January 31, 2022 |

|
An open ended index Scheme, investing in overseas Securities listed on the Exchange in the form of an Exchange Traded Fund (ETF) tracking the Hang Seng Index
The Scheme employs a passive investment approach designed to track the performance of Hang Seng TRI. The Scheme seeks to achieve this goal by investing in securities constituting the Hang Seng Index in same proportion as in the Index.
March 9, 2010
Kinjal Desai1, Siddharth Deb2
Hang Seng TRI
|
1 For foreign securities 2 For debt securities |
| Monthly Average : | ₹ 98.26 Cr |
| Month End : | ₹ 94.40 Cr |
| NAV as on January 31, 2022 | ₹ 298.5684 |
| Entry Load: | Nil |
| Exit Load: | Nil |
| Standard Deviation | 4.57 |
| Beta | 0.95 |
| Sharpe Ratio | -0.07 |
| Note: The above measures have been calculated using monthly rolling returns for 36 months period with 3.4% risk free return (FBIL Overnight MIBOR as on 31/01/2022). | |
| Portfolio Turnover(Times) | 0.34 |
| Tracking Error@ | 0.56% |
| Creation Unit Size | 25,000 units |
| Pricing (per unit)(approximately) | 1/100th of Index |
| Exchange Listed | NSE, BSE |
| Exchange Symbol | HNGSNGBEES |
| ISIN | INF204KB19I1 |
| Bloomberg Code | HSBEES IS Equity |
| Reuters Code | HNGS.NS & HNGS.BO |
| Total Expense Ratio^ | 0.86 |
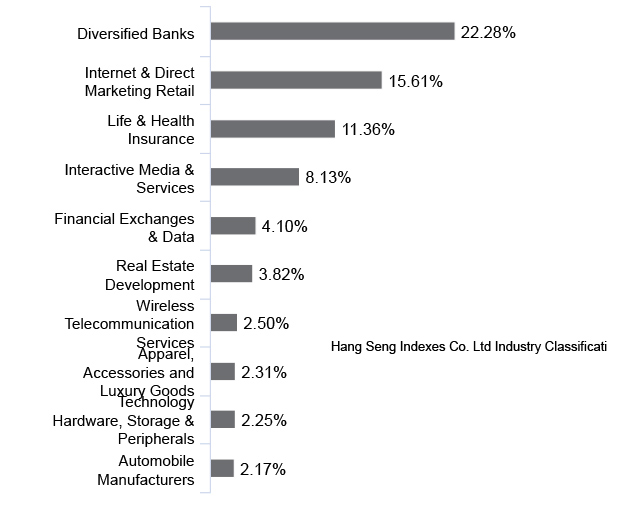
| Company/Issuer | % of Assets |
| Diversified Banks | |
| Bank Of China Ltd | 1.88 |
| China Construct BK-H | 5.03 |
| HSBC HOLDINGS PLC | 8.93 |
| Industrial and Commercial Bank of China Ltd | 2.71 |
| China Merchants Bank Co. Ltd. - H Shares | 1.97 |
| Electric Utilities | |
| CLP Holdings Ltd | 1.22 |
| Electronic Components | |
| Sunny Optical Tech | 1.10 |
| Financial Exchanges & Data | |
| Hong Kong Exchanges and Clearing Ltd | 4.10 |
| Gas Utilities | |
| The Hong Kong China Gas Company Limited | 1.04 |
| Industrial Conglomerates | |
| CK Hutchison Holdings Limited | 1.15 |
| Interactive Media & Services | |
| Tencent Holdings Ltd | 8.13 |
| Life & Health Insurance | |
| AIA Group Ltd | 7.60 |
| Ping An Insurance Group Co Of China Ltd | 2.98 |
| Oil & Gas Exploration & Production | |
| Cnooc Ltd | 1.30 |
| Retail REITs | |
| Link REIT NPV | 1.09 |
| Wireless Telecommunication Services | |
| China Mobile Ltd | 2.5 |
| Industrial Machinery | |
| Techtronic Industries Co Ltd. | 1.45 |
| Apparel, Accessories and Luxury Goods | |
| Shenzhou International Group Holdings Ltd | 1.01 |
| Li Ning Company Limited | 1.3 |
| Life Sciences Tools & Services | |
| WuXi Biologics (Cayman) Inc. | 2.11 |
| Technology Hardware, Storage & Peripherals | |
| Xiaomi Corporation | 2.25 |
| Internet & Direct Marketing Retail | |
| Alibaba Group Holding Limited | 6.73 |
| Meituan | 7.31 |
| JD.com Inc | 1.57 |
| Automobile Manufacturers | |
| BYD Company Limited - H shares | 1.41 |
| Equity Less Than 1% of Corpus | 21.66 |
| Cash and Other Receivables | 0.46 |
| Grand Total | 100.00 |
*Top 10 Holdings
| Full market capitalisation (₹ Cr) | 22,363,977.43 |
| P/E | 15.65 |
| Dividend Yield | 2.39 |
This product is suitable for investors who are seeking*:
• Long-term capital appreciation
• Investment in Securities covered by Hang Seng Index
Fund Riskometer
Nippon India ETF Hang Seng
BeES
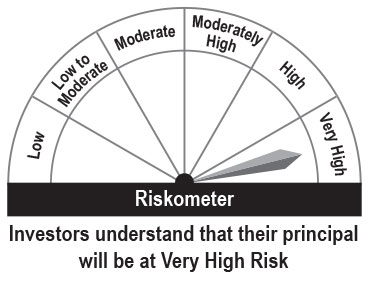
Benchmark Riskometer
Hang Seng TRI

* Investors should consult their financial advisers if in doubt about whether the product is suitable for them.
Please click here for explanation on symbol: ^ and @ wherever available
For scheme performance please click here. For Fund manager wise scheme performance click here.